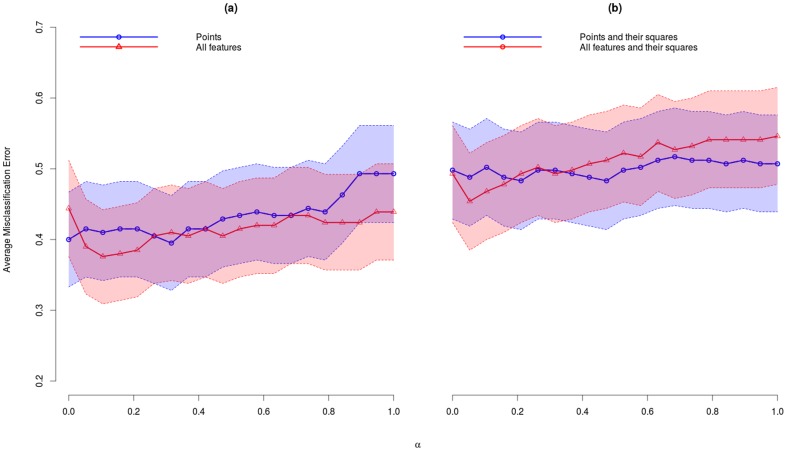
Figure 3. Average misclassification error glmnet.
Average misclassification error with 95% confidence intervals across leave-one-out cross-validation for models with different values of mixing parameter α. (a) all features (red) and only points (blue) were used and (b) all features and their squares (red) and only points and their squares (blue) were used.

