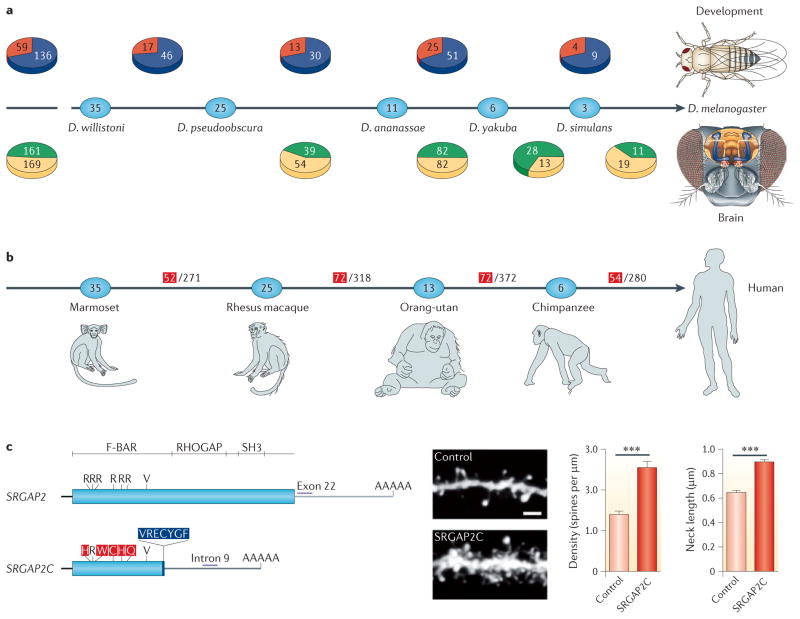
Figure 3. The involvement of new genes in the development of Drosophila spp., and in the brains of Drosophila spp. and humans.
a | The phylogeny shows the distributions of new Drosophila spp. genes involved in development46 (above) and in the brain76 (below) in various evolutionary stages within the past 36 million years81. The numbers in the ovals show the divergence time (in millions of years) between Drosophila melanogaster and various Drosophila spp. Red represents the number of new genes that were found to have essential developmental functions, whereas blue shows the number of new genes that were non-essential in development. Green represents the number of new genes that were expressed in the brain, and yellow shows the number of the non-brain-expressed new genes in reverse transcription PCR screening experiments. The left-most pie charts show the total numbers of new genes across all analysed stages. For the developmental data, the origination events at 3–6 million years ago (MYA) and 0–3 MYA are pooled. These data reveal that older genes are no more likely than newer genes to have evolved essential developmental functions or brain expression, suggesting the rapid evolution of phenotypic effects in new genes. b | The phylogeny shows the numbers of new genes in the human genome that originated at various stages during the divergence of human ancestors from the ancestors of other primates11 through duplication (DNA based and RNA based) and de novo mechanisms (BOX 1). The numbers within the ovals show divergence time (MYA). The numbers in the denominators are the total numbers of new genes that originated in each evolutionary branch, as identified previously67, and the red numerators are the numbers of those new genes that are expressed in the prefrontal cortex (PFC), as detected based on the available microarray expression data. The PFC is the anterior part of the frontal lobe of the neocortex, which is implicated in cognitive functions in the developing human brain. These data suggest that new genes have been frequently acquired into the PFC transcriptome. c | The SLIT–ROBO RHO GTPase-activating protein 2C (SRGAP2C) gene is one of the 54 PFC-expressed human-specific new genes (the end branch of the tree in part b). It was formed by DNA-based duplication and has been subjected to extensive genetic and evolutionary analyses109,110 and functional characterization110. The gene structure shows that SRGAP2C (bottom) is a duplicate of the amino-terminal part of the parental gene, SRGAP2 (top). The transgenic expression of SRGAP2C in cultured mouse cortical neurons induces denser and longer spines, as shown in the dendrite images (scale bar represents 2 μm), and the measured spine density and neck length, shown in the graphs on the right. *** indicates a significance of P<0.001. D. ananassae, Drosophila ananassae; D. pseudoobscura, Drosophila pseudoobscura; D. simulans, Drosophila simulans; D. willistoni, Drosophila willistoni; D. yakuba, Drosophila yakuba. Part c is modified, with permission, from REF. 110 © (2012) Elsevier Science.

