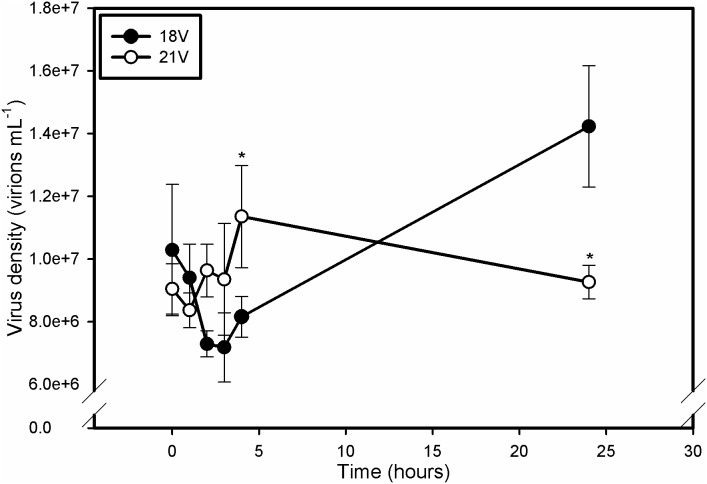
Figure 4. Time course of viral absorption and production.
The initial decrease in EhV abundance in 18V represents successful adsorption to and absorption into the host membrane. Emergence of EhV progeny is evident by 4 h. Time-points in 21V are never significantly different from one another, but are different from 18V by hour 4. Resistance of 21V appears to be derived from an inability of the virus to bind to or cross host membranes. Error bars represent one standard deviation, and asterisks represent statistical significance according to a Holm-Sidak t-test (p<0.05). Data were ln transformed for statistical analysis.

