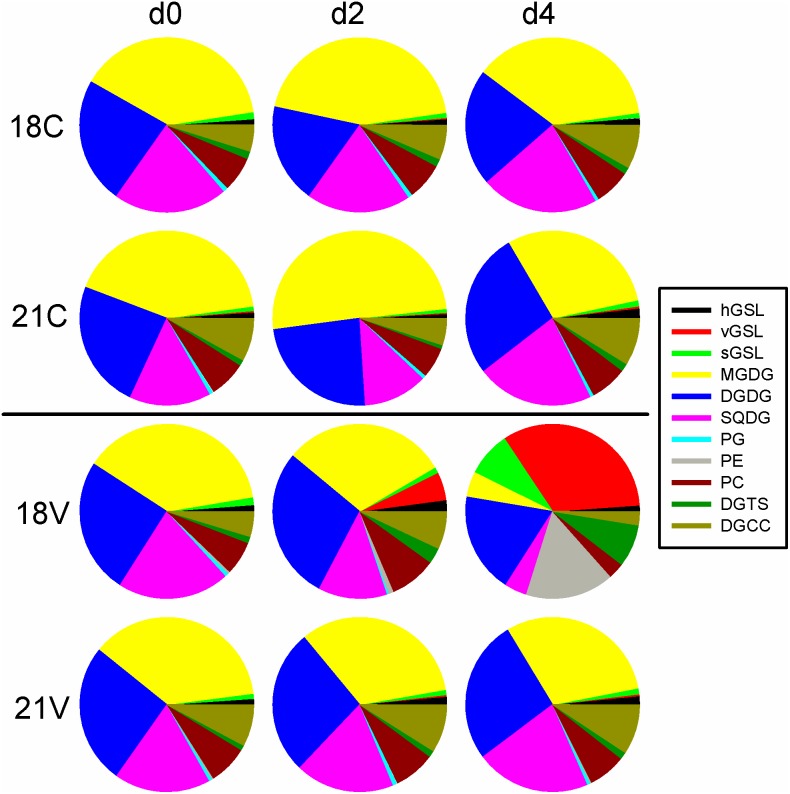
Figure 5. Intact Polar Lipids.
Pie charts represent relative concentrations of individual lipids at days 0, 2, and 4 in the respective treatments. Colors are explained in the legend (right). Viral GSLs (red pie slices) accumulated in 18V and not the other treatments again indicating successful infection. Chloroplast lipids such as MGDG (yellow slices), DGDG (blue slices), and SQDG (pink slices) decrease dramatically in 18V as photosynthetic efficiency decreases. 18V also demonstrates a significant decrease in diacylglycerylcarboxy-N-hydroxymethyl-choline (DGCC, dark green slices) which is involved in fatty acid transport into the MGDG synthesis pathway. Host derived GSLs are significantly higher in 21C than in 18C by day 4. GSL – Glycosphingolipid (h, v, and s represent host-derived, virus-derived, and scialic acid, respectively), MGDG – Monogalactosyldiacylglycerol, DGDG – Digalactosyldiacylglycerol, SQDG – Sulfoquinovosyldiacylglycerol, PG – Phosphatidylglycerol, PE – Phosphatidylethanolamine, PC – Phosphatidylcholine, DGTS – Diacylglyceryltrimethylhomoserine, DGCC – Diacylglycerylcarboxyhydroxymethylcholine.

