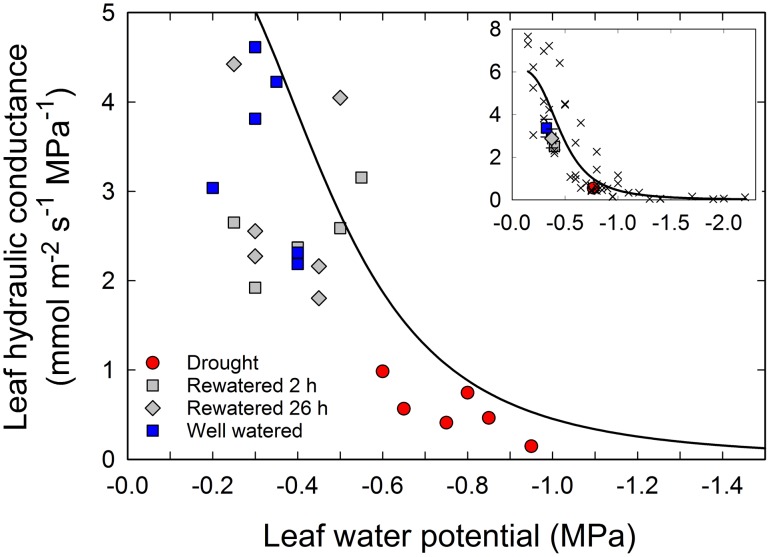
Figure 1. Effect of a change in water availability on leaf hydraulic conductance (K leaf) in Populus trichocarpa saplings.
K leaf and the associated leaf water potential (Ψleaf) were measured in 6 well-watered control plants (blue squares), 6 drought-stressed plants (red circles), and drought-stressed plants 2 and 26 h after rewatering (grey squares and diamonds, respectively). Each data point represents a single measurement of K leaf. The solid line shows the previously established vulnerability curve for K leaf. A 3 parameter logistic function was used for the curve fit: K leaf = 6.154/[1+(Ψleaf/0.469)3.337]. An overview of the complete vulnerability curve is shown in the upper right corner of the figure. Individual measurements are shown as crosses; the mean values for each group (±SE, n = 6) are shown using the same symbols as explained above.

