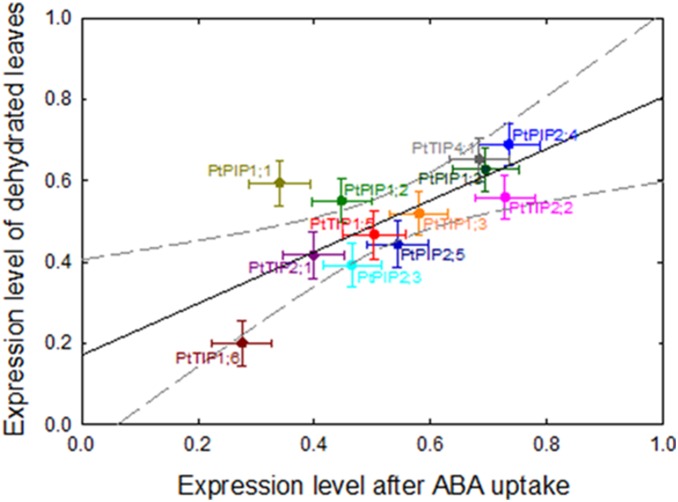
Figure 6. Relative expression of 12 aquaporin genes in response to dehydration (y-axis) and dehydration + perfusion with abscisic acid (x-axis).
Detached leaves were either dehydrated on the bench top for 1 h or dehydrated for 1 h and subsequently perfused for 1 h with 50 µM abscisic solution (ABA). Data from fully hydrated detached leaves (perfused for 3 h with 20 mM KCl+1 mM CaCl2 solution) were used as the control group, and their expression refers to a value of 1. Pearson’s r = 0.725; P≤0.01. Data are means ± SE of three biological replicates.

