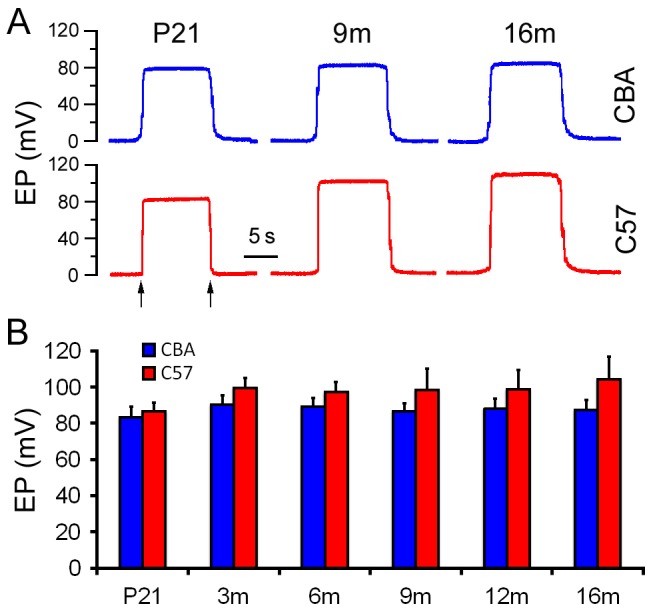
Figure 1. EP waveforms and magnitude change during aging.

A. Representative waveforms of EP at three different ages. B. Mean and SD of EP magnitude at different time points during aging. Arrows indicate electrode penetrated into and withdrawn from the scala media.
