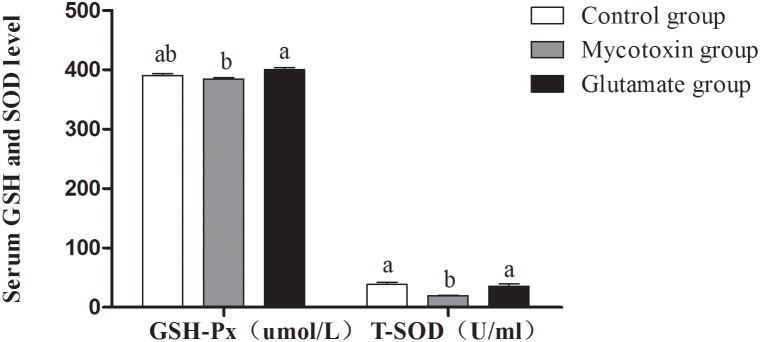
Figure 2. Serum GSH-Px and T-SOD activities in growing pigs fed mycotoxin-contaminated feed.

The treatments consisted of a control group (n = 5) receiving uncontaminated feed, a mycotoxin group (n = 5) receiving mould-contaminated diet, and the glutamate group (n = 5) receiving mould-contaminated diet and 2% glutamate. The data with different letters in the same factor differ significantly (P<0.05), and same letters means no significant difference (p>0.05).
