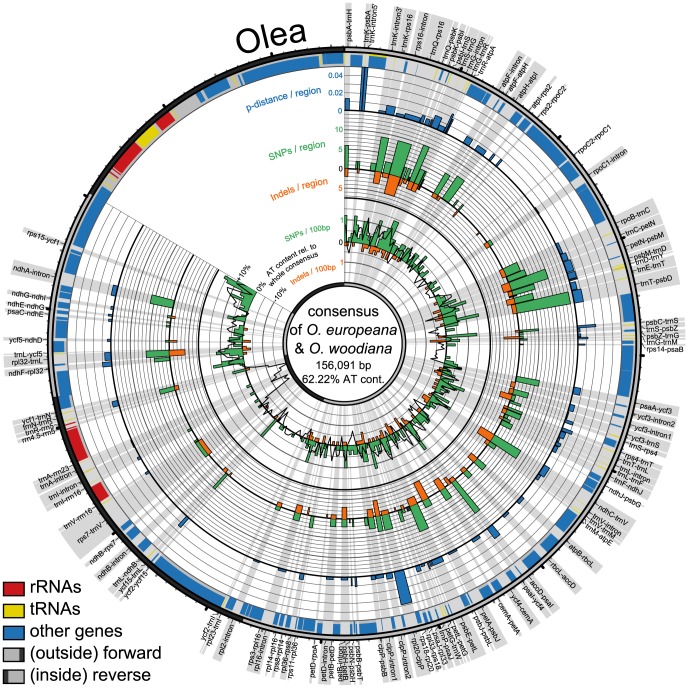
Figure 4. Circular representation of plastid genome pairs in Olea.
Shown are consensus sequences of compared species pairs of Olea europaea and O. woodiana with their differing p-distances, numbers of SNPs and indels across the consensus. Radial grey highlights show the regions in focus of study with their names. Circular graphs from outside to inside: outermost circle with ticks for every 1,000 bp (small) and 10,000 bp (big) indicates part of genome, single copy regions in light grey and inverted repeats in dark grey; bands show locations of genes (blue), tRNAs (yellow) and rRNAs (red); the three outermost histograms display p-distances (blue), number of SNPs (green) and indels (orange) per spacer region; innermost graph shows number of SNPs (green histogram), indels (orange histogram), and AT content relative to the whole consensus (black line graph) of 500 bp long parts of the whole consensus.

