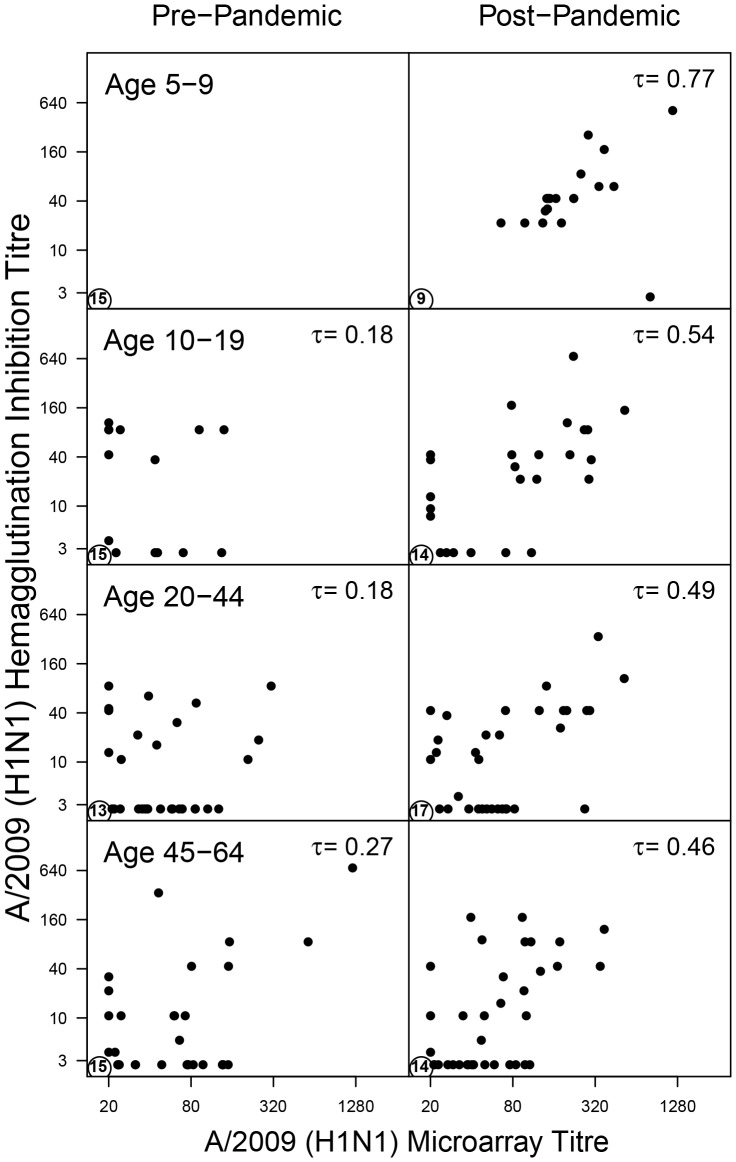
Figure 1. Standardised hemagglutination inhibition titers as a function of A/2009 microarray titers.
Data are stratified by study and age group (5–9, 10–19, 20–44, and 45–65 years). The bottom left corner in each panel shows the number of samples that tested negative in both assays. The top right corner shows Kendall's tau, a nonparametric correlation coefficient.

