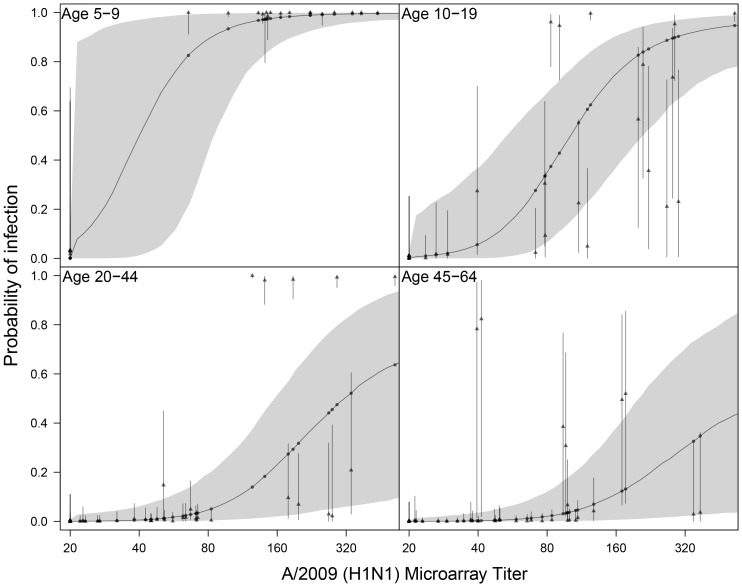
Figure 4. Classification of sera in the uni- and bivariate mixture analyses as a function of the microarray response to A/2009 (H1N1).
Shown are the estimated probabilty of infection in the univariate mixture (dots and solid line) with associated 95% confidence envelope (shaded area), and for each sample the corresponding estimates in the bivariate mixture (triangles) with associated 95% confidence intervals (bars).

