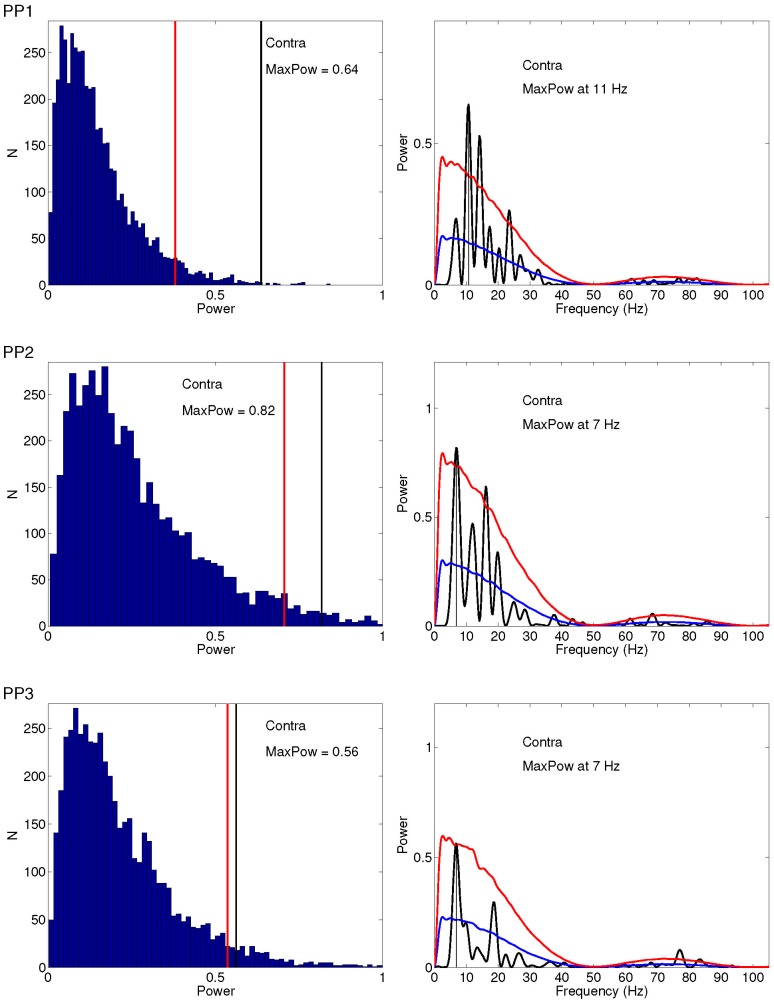
Figure 5. Statistical significance of periodicity in SRTs for contralateral presentation for all participants.
Left: Distribution of amplitudes across shuffled time series ( ) of the frequency that showed maximum amplitude in the observed time series Right: The original spectrum (black line) plotted against mean spectrum (blue line averaged across n = 5000 spectral samples from the set of shuffled time series. Red lines indicate one-sided confidence interval bound (
 ).
).

