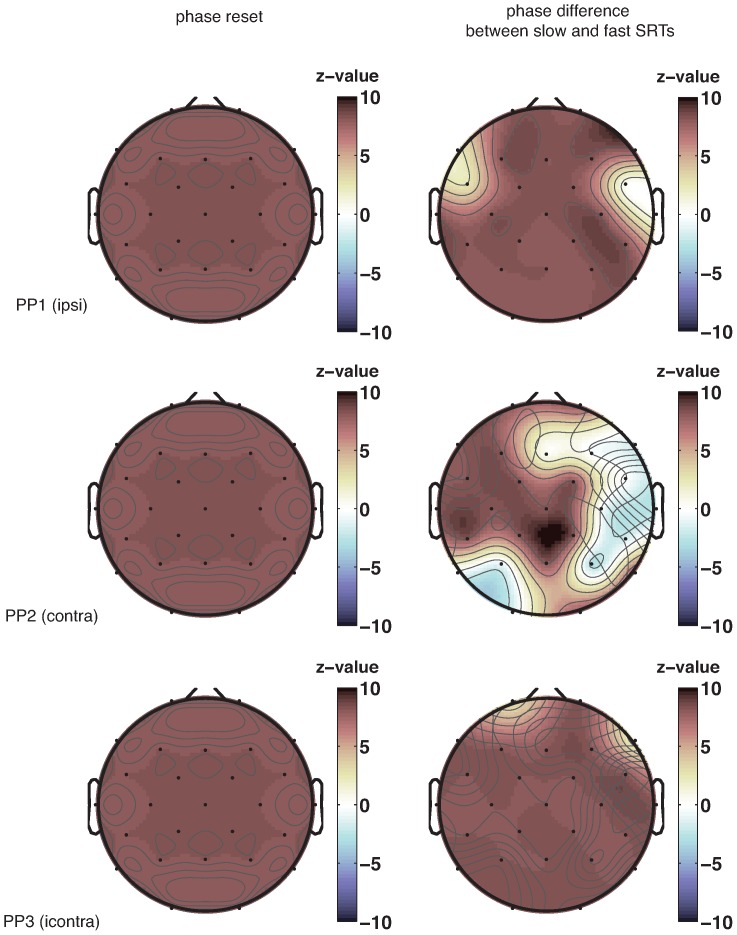
Figure 7. Randomization tests of phase-locking.
Topographical plots of z-scores of the randomization tests of phase-locking to the sound (1) and phase-dependent differences in SRTs (2) at the frequency of 7 Hz. Every row shows a different participant. Phase reset due to the sound stimulus occurs in almost all channels. A phase difference between fast and slow SRTs occurs primarily in central channels.

