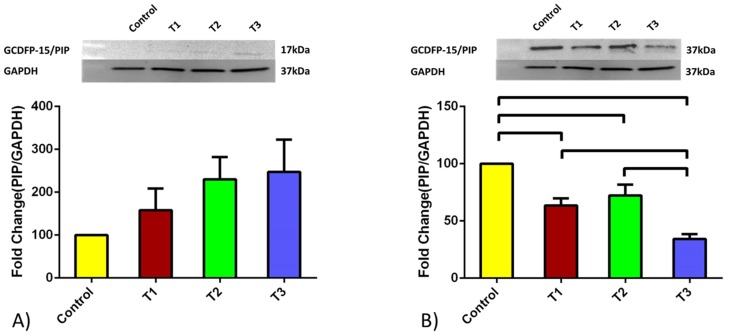
Figure 3. PIP quantified protein expression for A) HCF and B) HKC cell types.
Four conditions were tested: Control, TGF-β1, TGF-β2, and TGF-β3. HCFs expression was increased upon TGFβ treatments however none of them reached significance. HKCs showed significant down regulation upon all TGFβ treatments. TGFβ3 showed the lowest PIP protein levels compared to all other conditions. HKCs PIP protein levels were consistently lower under all conditions when compared to HCFs. Note: HCF’s PIP expression was seen at 17 kDa protein whereas in HKC’s at 37 kDa. All error bars represent standard error (SEM) of n = 3.

