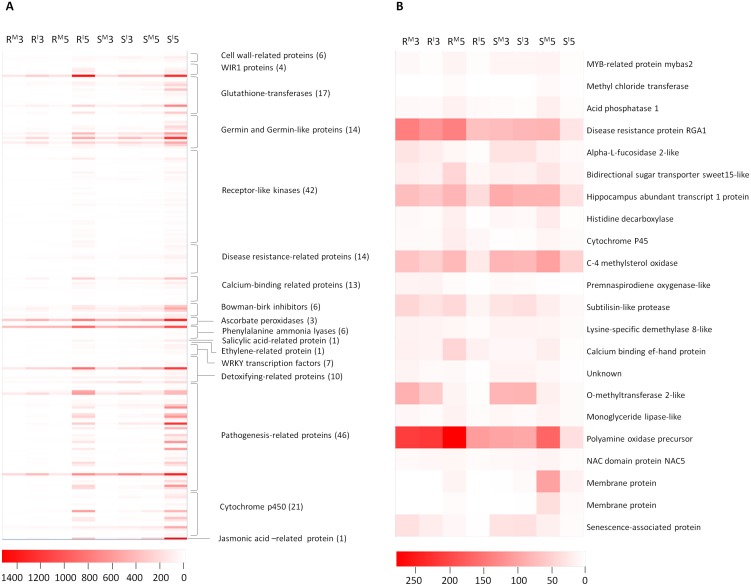
Figure 4. Heat maps showing up- (A) or down - regulated genes (B) belonging to various classes in Family A detected between pseudograminearum infection (Fp-infection) and water treatment (mocks) at 3 dpi and 5 dpi, respectively.
Up- or down-regulated genes were determined with the threshold of FDR≤0.01 and the absolute value of log2 FoldChange ≥1 or ≤−1 or ‘inf’ (the value of one comparative object is zero and the other one is not). Symbols are ‘M’ for mock; ‘I’ for Fp-infection; ‘3’ for 3 dpi; ‘5’ for 5 dpi; ‘R’ for resistant isoline; ‘S’ for susceptible isoline. The color key represents the RPKM normalized value. Lighter color indicates greater transcript accumulation. Each column represents a sample and each row a gene.

