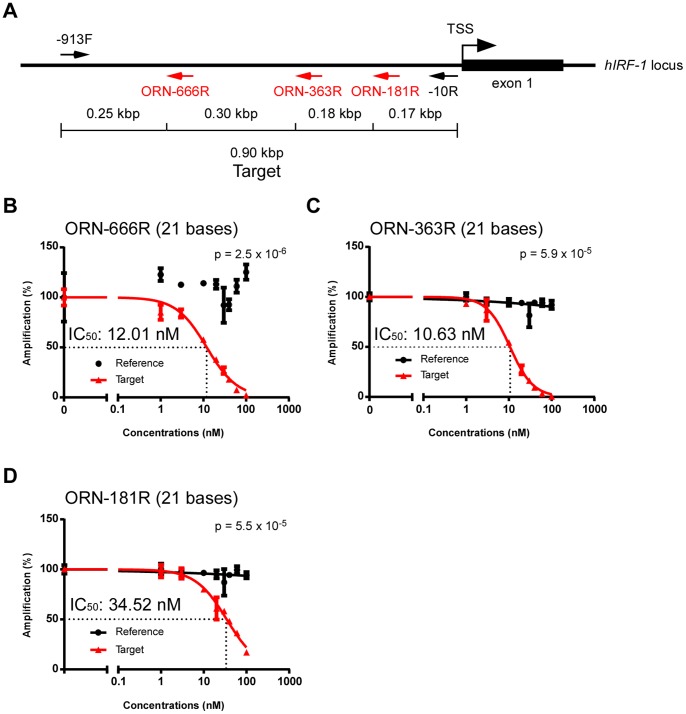
Figure 2. Effects of ORN position on inhibition of PCR amplification.
(A) Positions of ORNs in the target region. (B–D) Dose responses of ORNs. Real-time PCR amplification in the presence of various concentrations of ORNs was normalized against the value in the absence of ORNs. Dose-response curves were generated using the Prism software; Prism was not able to generate a curve of the reference for ORN-666R (B). Data are represented as means ± S.D. (n = 3). P-values for the differences in amplification between the reference and the target at an ORN concentration of 10 nM were calculated using Student’s t-test (B–D).

