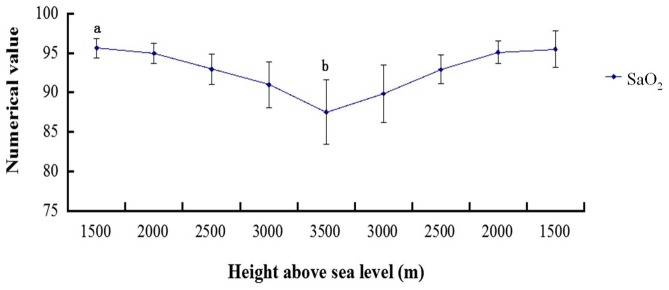
Figure 1. Graph showing the SaO2 during the ascent and descent phases.

a P<0.01: compared with the altitudes of 2500 m, 3000 m, and 3500 m; b P<0.01: compared with the altitudes of 3000 m, 2500 m, 2000 m, and 1500 m.

a P<0.01: compared with the altitudes of 2500 m, 3000 m, and 3500 m; b P<0.01: compared with the altitudes of 3000 m, 2500 m, 2000 m, and 1500 m.