
Figure 1. Graph showing the SaO2 during the ascent and descent phases.
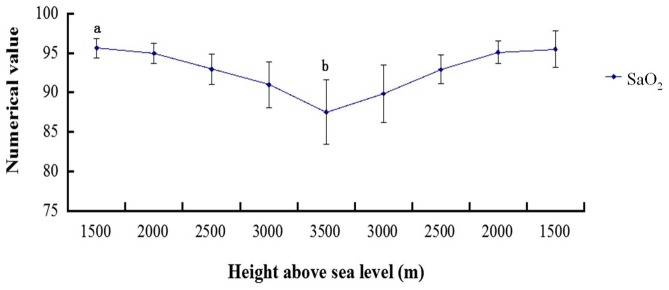
a P<0.01: compared with the altitudes of 2500 m, 3000 m, and 3500 m; b P<0.01: compared with the altitudes of 3000 m, 2500 m, 2000 m, and 1500 m.
Official websites use .gov
A
.gov website belongs to an official
government organization in the United States.
Secure .gov websites use HTTPS
A lock (
) or https:// means you've safely
connected to the .gov website. Share sensitive
information only on official, secure websites.
a P<0.01: compared with the altitudes of 2500 m, 3000 m, and 3500 m; b P<0.01: compared with the altitudes of 3000 m, 2500 m, 2000 m, and 1500 m.