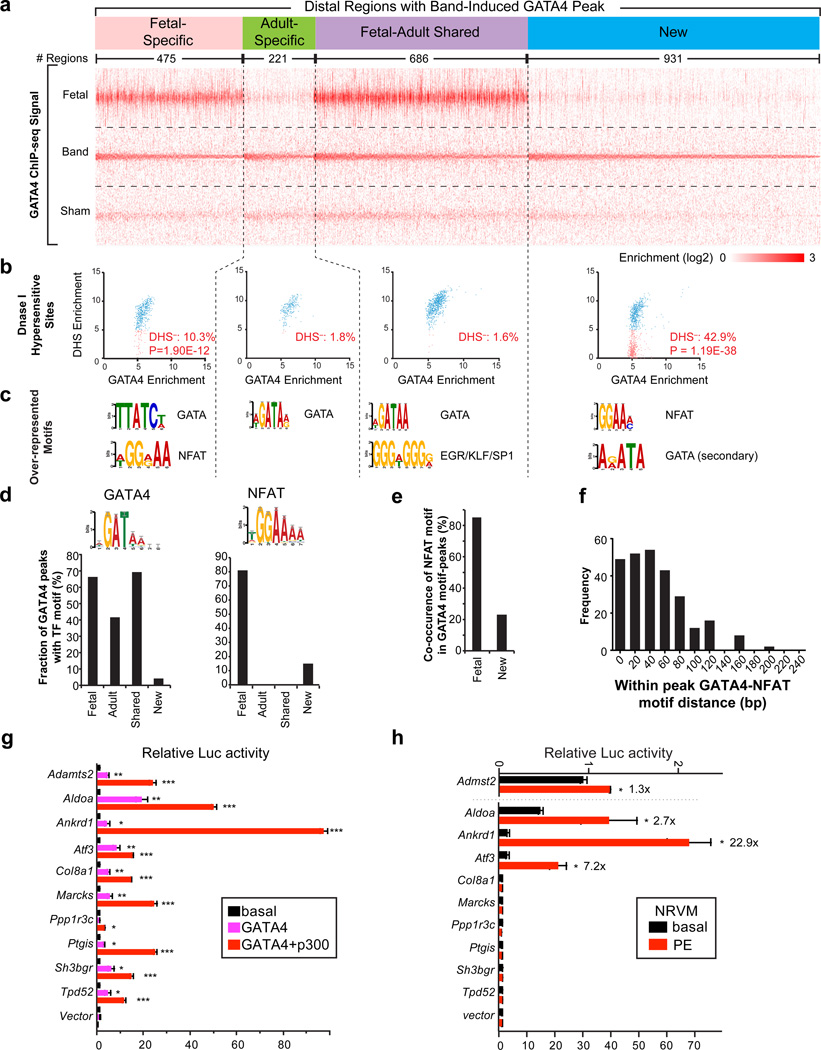
Figure 7. The cardiac hypertrophic transcriptional program reflects re-establishment of fetal GATA4 binding and acquisition of new GATA4 binding sites.
(a) Tag heatmap of distal regions containing Band-Induced GATA4 regions. These regions were classified by their overlap with Fetal-Specific, Adult-Specific, or Fetal-Adult Shared peaks. Those without overlap were labeled “New”. Within each group, regions were sorted by the enrichment score in Band. (b) Relationship of Band-Induced distal GATA4 regions with DNaseI Hypersensitive sites (DHS) of normal adult heart to GATA4 binding. DHS data was obtained by ENCODE.33 Blue and pink indicates regions with and without significant DHS signal, respectively. P-value indicates the significance of the difference in overlap of Fetal-Specific or New regions compared to Adult-Specific or Shared regions (Fisher exact test). (c) Over-represented motifs found by de novo motif discovery in distal GATA4 Band-induced regions, based on their overlap with developmental GATA4 regions. (d) Motif scanning with the indicated motifs showed their frequency in Fetal-Specific, Adult-Specific, Shared and New classes of distal, Band-induced GATA4 regions. (e) Co-occurrence of GATA and NFAT motifs in the same peak region, among distal, Band-induced GATA4 regions that overlapped with Fetal-Specific and New peaks. (f) Distribution of distance of GATA4 and NFAT motifs in the GATA4 peaks in panel (e). (g) Luciferase assay of selected enhancers in 293T cells under basal conditions or in the presence of GATA4 or GATA4+p300 overexpression. (h) Luciferase assay of selected enhancers in neonatal rat ventricular myocytes (NRVMs). NRVMs were transfected with indicated enhancer-luciferase constructs and stimulated with or without PE for 30 hrs. Relative luciferase activity was expressed as fold change against the unstimulated empty vector. Number over bars indicates fold-stimulation by PE. b, Fisher exact test. g and h, t-test. *, P<0.05; **, P<0.01; ***, P<0.001. Error bars, s.e.m.

