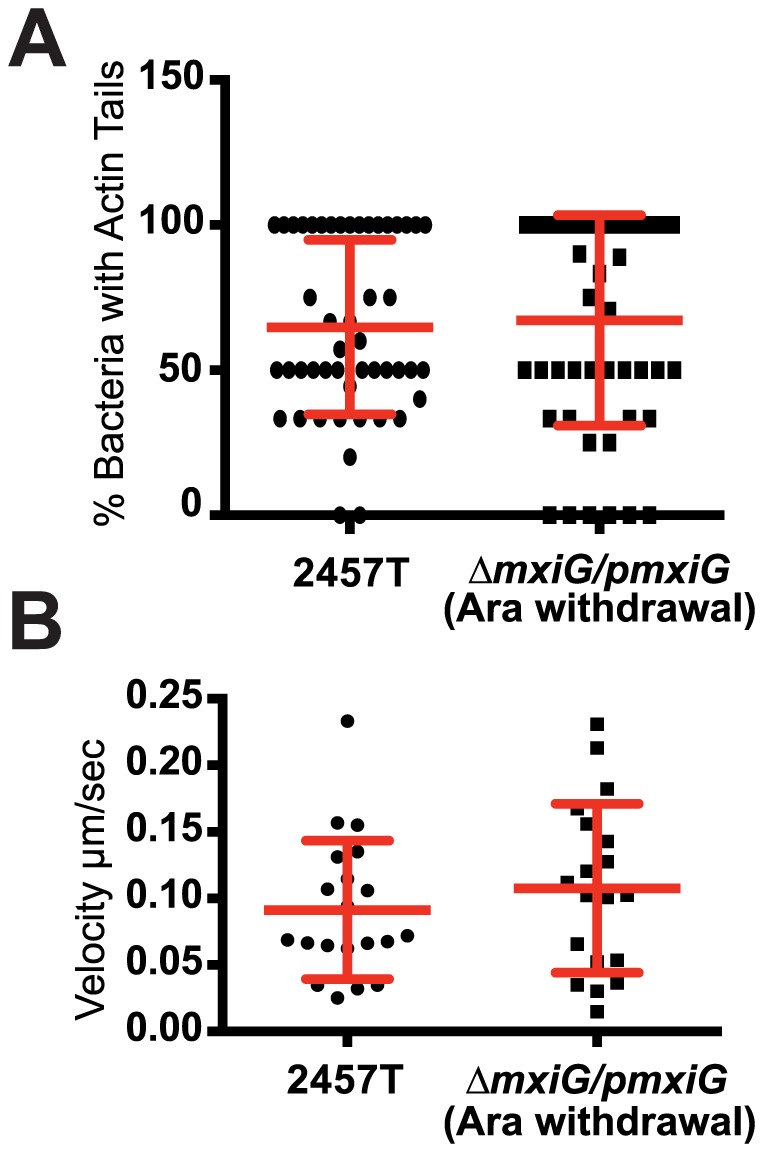
Figure 2. Quantification of intracellular motility.

(A and B) Infection of HT-29 cells with CFP-expressing wild type and ΔmxiG/pmxiG (Ara withdrawal) strains. (A) Graph showing the percent of bacteria with actin tail in the cytoplasm of HT-29 cells 2 h post infection. Points represent the percent of bacteria with actin tail per infected cell. Red bars indicate the mean +/- SD of three independent experiments. Statistical analysis: p = 0.73. (B) Graph showing the velocity of wild type and ΔmxiG/pmxiG (Ara withdrawal) bacteria in the cytoplasm of HT-29 cells 2 h post infection. Points represent the average velocity of individual bacteria. Red bars indicate the mean +/−SD of three independent experiments. Statistical analysis: p = 0.39, unpaired t test.
