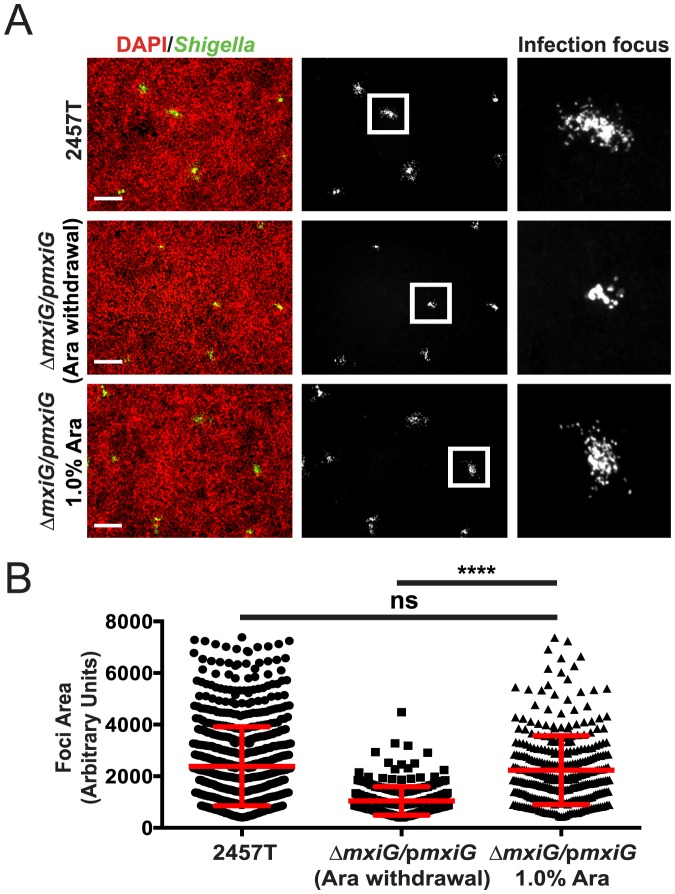
Figure 3. Quantification of S. flexneri dissemination in HT-29 cells.
(A,B) Infection of HT-29 cells with CFP-expressing S. flexneri. (A) Representative images showing the size of infection foci 8 h post infection comparing wild-type 2457T to the ΔmxiG strain complemented with pmxiG with 1.0% arabinose removed after the initial 30 minutes of infection (ΔmxiG/pmxiG (Ara withdrawal)), and the ΔmxiG mutant complemented with pmxiG with 1.0% arabinose throughout infection (ΔmxiG/pmxiG 1.0% Ara). Green, Shigella; red, DNA. Scale bar, 200 µm. (B) Computer-assisted image analysis was used to quantify the size of the infection foci and the average focus size was determined. Individual points represent individual foci, red bars indicate the mean +/−SD. Statistical analysis; ****, p<0.0001, unpaired t-test.

