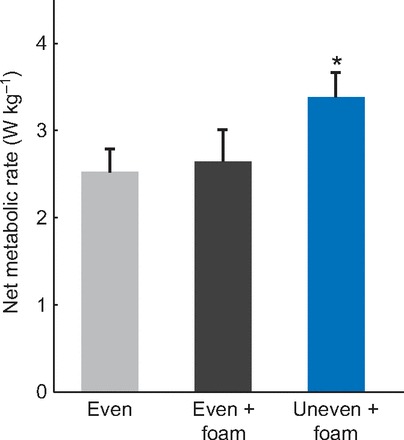
Fig. 6.

Net metabolic rate for three terrain conditions. Metabolic rates are normalized by subject mass. Values shown are means over subjects, with error bars indicating standard deviations. Asterisk indicates a statistically significant difference between the uneven + foam walking condition and the other two conditions (α=0.05).
