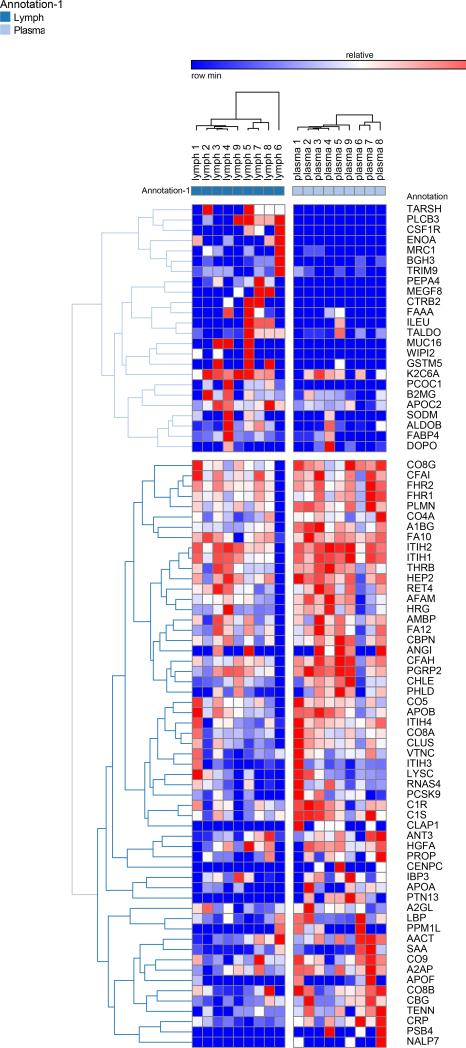
Figure 3.
Hierarchical clustering analyses of quantitative dynamic changes of post-shock mesenteric lymph and plasma proteins, either increasing in the upper cluster, or decreasing in the lower on, as a result of a Mascot search including semitryptic peptides and at least one peptide (>95% probability, Mascot score>30) for a positive identification. Only proteins non-redundant with Figure 1 were plotted. Quantitative information was gleaned through label free quantitative proteomics analyses on paired samples from 9 patients undergoing semi-elective spine injury reconstruction. Quantitative emPAI values were obtained through Mascot search and exported from Scaffold into xls file for heat mapping and hierarchical clustering analysis (Pearson correlation-1) through the software GENE-E. Values increase progressively from blue to red in the color scale, as indicated in the legends on top of each cluster. Proteins are enlisted with their relative UniProt ID names, though the _HUMAN taxonomy specification for Homo sapiens has been deleted as to improve the clarity of the figure. Further details are reported in Table 3 (protein list).

