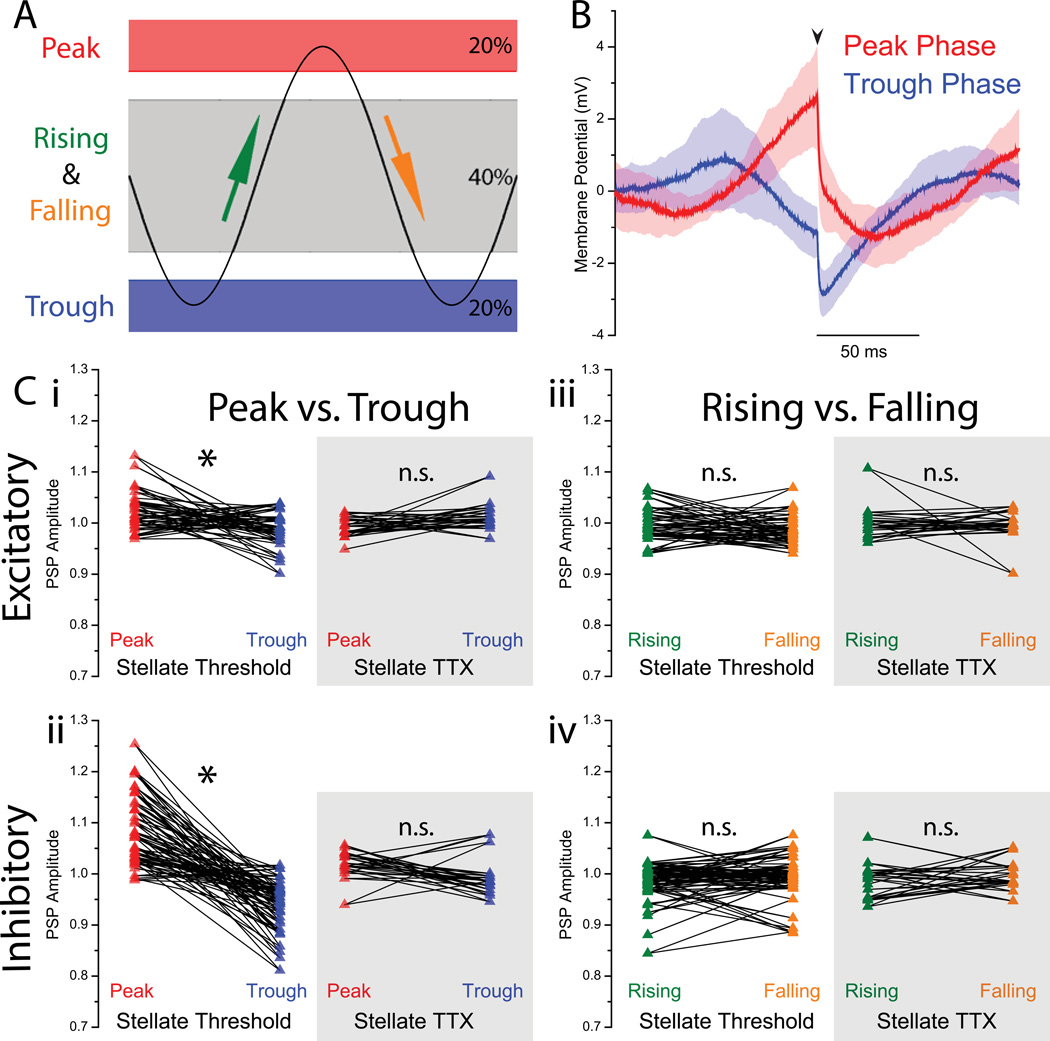
Figure 5. Effect of membrane potential oscillation phase on synaptic integration.
A PSPs were grouped into four different categories: peak, trough, rising phase, and falling phase. Detrended data were divided into bands representing each category: the 20% most depolarized membrane potential were labeled “peak phase” trials, while the 20% most hyperpolarized band were labeled “trough phase” trials. From the middle band representing 40% of the membrane potential range, PSPs following an increase in membrane potential were labeled “rising phase” PSPs; those following a decrease in membrane potential were labeled “falling phase” PSPs. B A sample waveform average from one trial showing the PSP-triggered average of all peak phase PSPs and trough phase PSPs. An arrow denotes the beginning of the artificial PSP injection. Shaded region indicates standard error associated with the waveform average. Note the larger magnitude associated with peak phase PSPs relative to trough phase PSPs, as well as the intrinsic MPO preceding the PSP. C For each trial, the average PSP amplitude for peak (rising) phase PSPs are compared to the average PSP amplitude for trough (falling) phase PSPs (stellates near threshold, n = 29 in 24 cells for excitatory, n = 41 in 26 cells for inhibitory; stellates in TTX, n = 15 in 11 cells for excitatory, n = 15 in 10 cells for inhibitory). Peak phase PSP amplitudes were significantly larger (p < 10−3 for both inhibitory and excitatory, paired sample t-test) than their corresponding trough phase PSP amplitudes (i, ii). This effect was eliminated for PSPs in TTX, which showed no significant difference between matched peak vs. trough PSP amplitudes. Rising and falling phase PSPs showed now significant difference in any condition, for neither excitatory nor inhibitory trials.

