Figure 1. Ex-vivo expansion of flow-sorted putative Tregs and the estimation of the accessible peripheral blood Treg pool in rhesus macaques.
A. Left panel: Treg expansion strategy: Flow-sorted putative Tregs were expanded with three rounds of stimulation with anti-CD3 and anti-CD28-antibody coated magnetic beads on day 0, 12 and 24 and cultured as previously described (18) before harvesting on day 36.
Middle panel: Expansion kinetics of ex-vivo cultured Tregs. Shown are the mean cell numbers (+/− SEM) for five Treg expansions (from 3 separate animals) that each occurred over a 36-day culture period.
Right panel: Phenotype of ex-vivo expanded Tregs: The phenotype of the expanded Tregs was analyzed by flow cytometry using an antibody panel consisting of anti-CD3, CD4, CD25, CD127 and FoxP3. Gated CD3+CD4+ cells were then analyzed for the expression of CD25, CD127 and FoxP3. A representative example from nine independent expansions derived from three animals is shown.
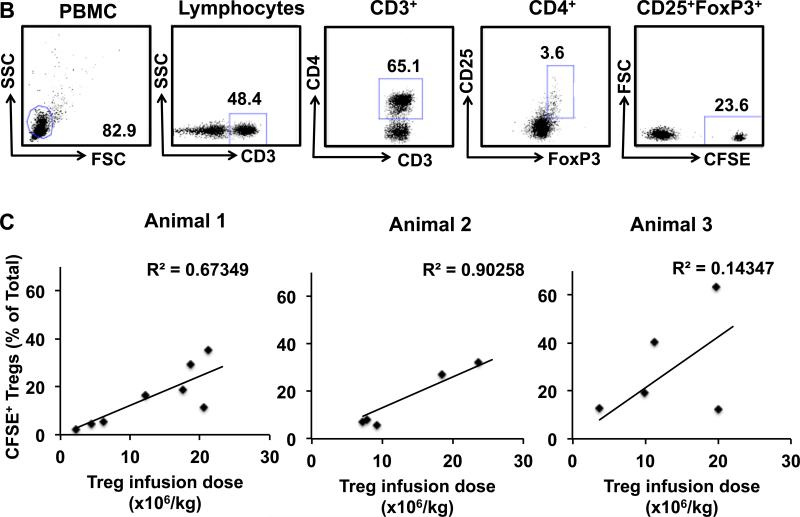
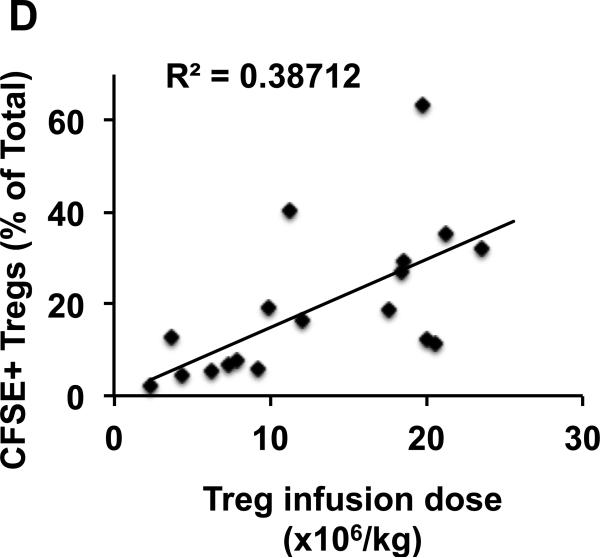
B-D Estimation of the accessible Treg pool in rhesus macaques.
B. Gating strategy for the detection of CFSE-labeled infused Tregs. Tregs were identified by gating on the CD3+CD4+CD25+FoxP3+ cells in the PBMC fraction. Infused Tregs were then separated from the endogenous Tregs based on their CFSE label.
C. Linear regression analysis showing progressively increasing Treg infusion doses and the resulting increasing percentage that infused CFSE+ Tregs made up of the total peripheral blood Tregs. Data from three individual animals is shown.
D. Combined data from three individual animals is shown with linear regression analysis of the entire data set.


