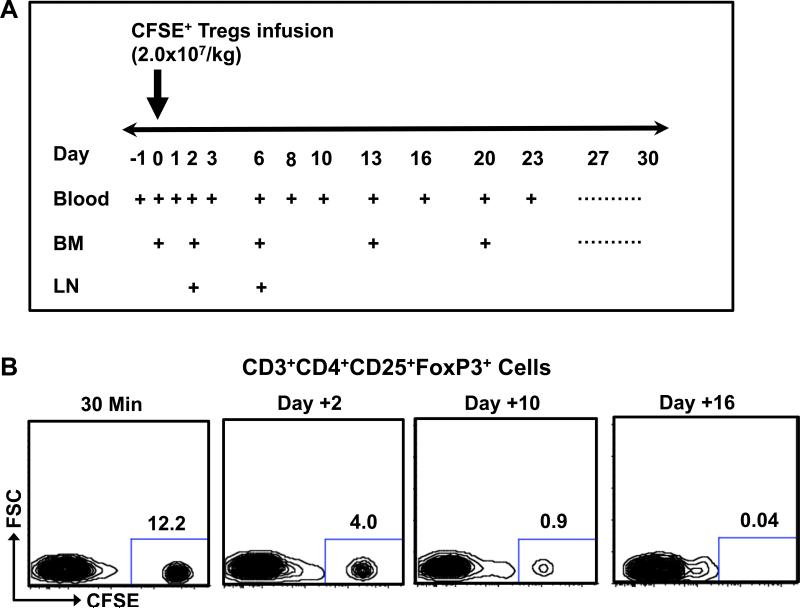
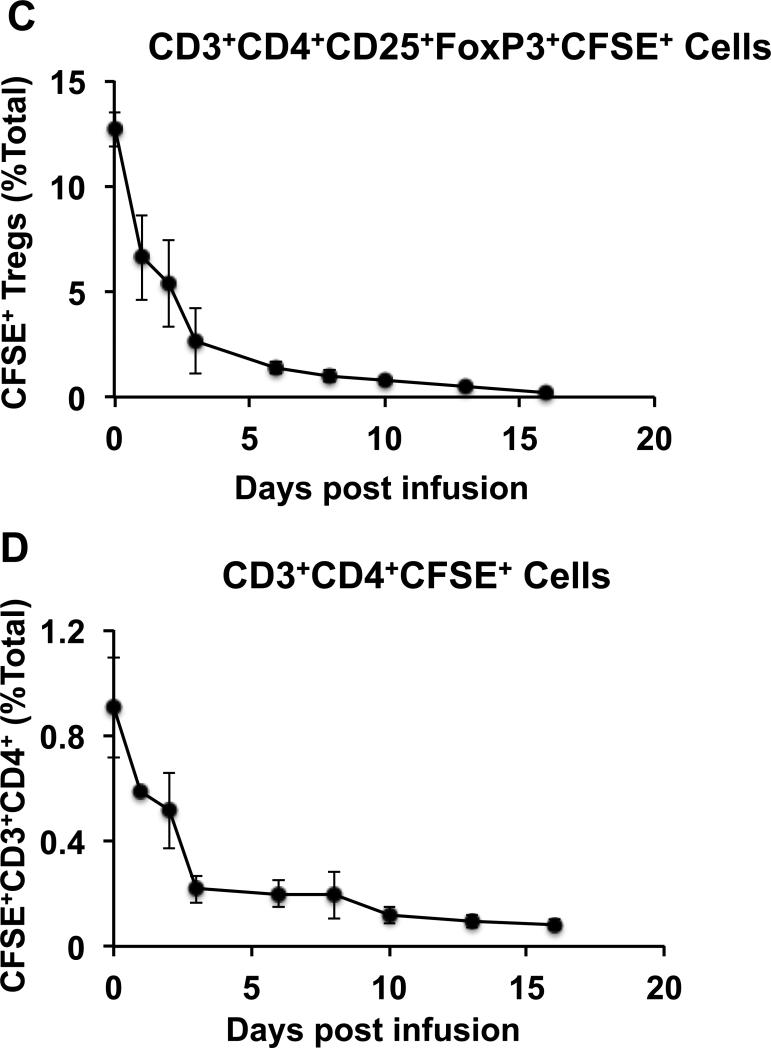
Figure 2. Elimination kinetics of ex vivo expanded CFSE-labeled Tregs from the peripheral blood after intravenous infusion.
A. Strategy for blood draws, bone marrow aspirates and LN biopsies after Treg infusion.
B. Representative flow cytometric analysis of CD3+CD4+CD25+FoxP3+ cells after infusion. Infused Tregs were separated from the endogenous Treg pool based on their CFSE label.
C. Percentage of CFSE+ Tregs in the CD3+CD4+CD25+FoxP3+ pool over a 16-day period after infusion. Data is shown as the mean ± SEM from three different animals.
D. Percentage of CFSE+ CD3+CD4+ cells in the CD3+CD4+ pool over a 16-day period after infusion. Data is shown as the mean ± SEM from three different animals.


