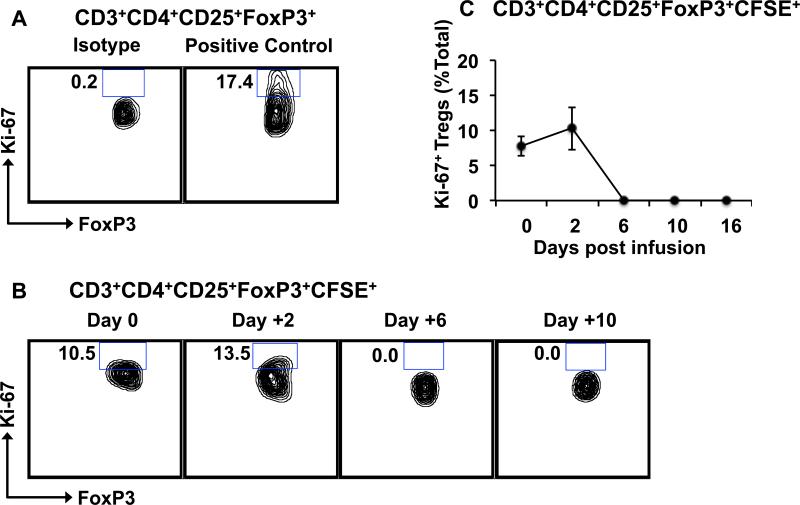
Figure 3. Infused CFSE-labeled Tregs do not proliferate after adoptive transfer.
Tregs in the peripheral blood were identified flow cytometrically by CD3, CD4, CD25 and FoxP3, and were then analyzed for FoxP3 and Ki-67 expression.
A. Representative contour plots showing positive-control Ki-67 staining of proliferating NHP Tregs.
B. Representative contour plots showing the frequencies of Ki-67+FoxP3+ cells in the infused CD3+CD4+CD25+FoxP3+CFSE+ population over time.
C. Summary data showing frequencies of Ki-67+ Tregs in the CD3+CD4+CD25+FoxP3+CFSE+ population over time. Data is shown as the mean ± SEM of three independent experiments.

