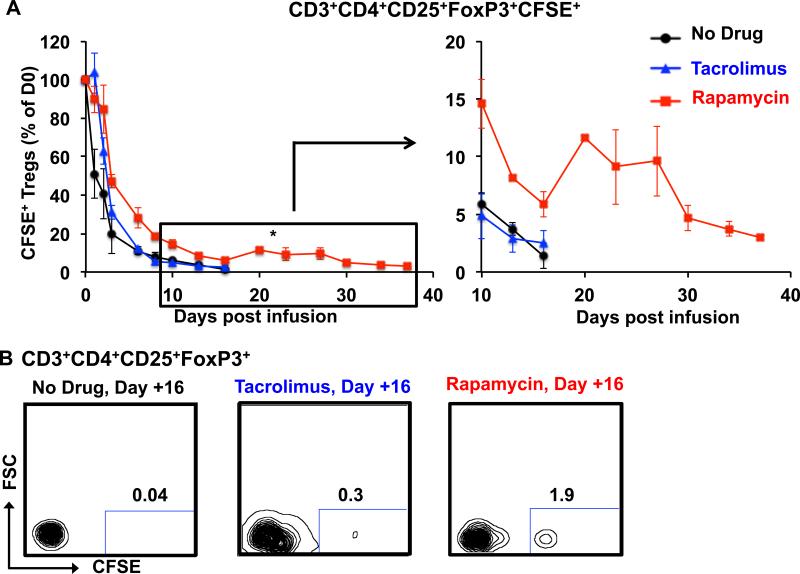
Figure 6. Rapamycin enhances the persistence and phenotypic integrity of infused Tregs after adoptive transfer.
Rhesus macaques were given either no drug (black circles), tacrolimus (blue triangles) or rapamycin (red squares) in the setting of Treg adoptive transfer. Drug levels were targeted to achieve a trough of 5-15 ng/ml for rapamycin and 8-12 ng/ml for tacrolimus. CFSE+ Tregs were infused intravenously and tracked longitudinally in blood by flow cytometric analysis of CD3, CD4, CD25, FoxP3 and CFSE expression.
A. Percentage of persisting CFSE+ Tregs in the three treatment groups over the follow-up period, with Day 0 samples shown as 100%. Black circles: Tregs infused without concomitant immunosuppression. Blue triangles: Tregs infused into animals treated with tacrolimus. Red squares: Tregs infused into animals treated with rapamycin. Shown are the mean ± SEM for each time-point (n = 3 independent animals for each treatment type). An enlarged version of the data from day +10 to day +37 is shown to the right. * represents p ≤ 0.05
B. Representative flow cytometric analysis on Day +16 is shown for animals receiving no drug, tacrolimus or rapamycin.
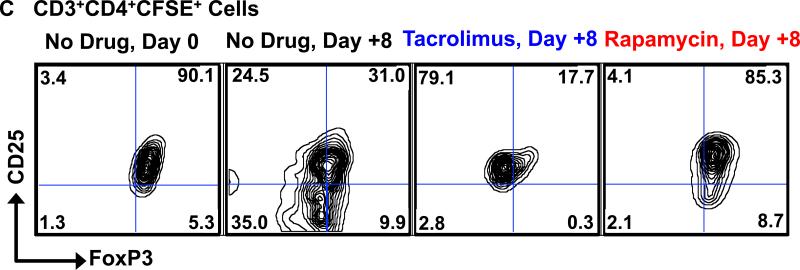
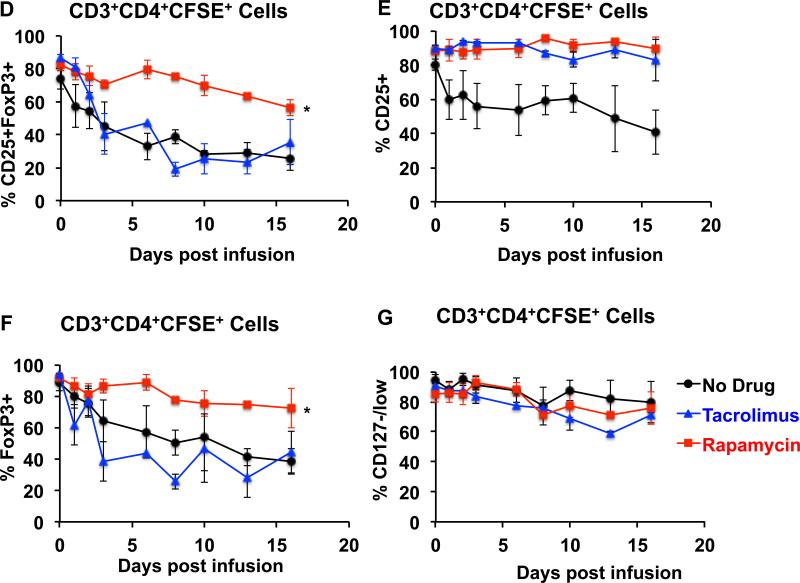
C-G. Rapamycin rescues the loss of phenotypic integrity of infused Tregs after adoptive transfer.
C. Representative flow cytometric analysis on Day +8 is shown for animals on no drug, tacrolimus and rapamycin (right three panels) compared to the flow cytometric analysis of the infused cells on Day 0 (30 minutes after infusion, far left panel).
D. Comparison of the combined longitudinal analysis of CD25+FoxP3+ cells in the total CD3+CD4+CFSE+ population between animals treated with no immunosuppression, with tacrolimus, or with rapamycin. Shown is the mean ± SEM of three independent experiments for each treatment regimen. * represents p ≤ 0.05.
E. Comparison of the combined longitudinal analysis of CD25+ cells in the total CD3+CD4+CFSE+ population between animals treated with no immunosuppression, with tacrolimus, or with rapamycin. Shown is the mean ± SEM of three independent experiments for each treatment regimen.
F. Comparison of the combined longitudinal analysis of FoxP3+ cells in the total CD3+CD4+CFSE+ population between animals treated with no immunosuppression, with tacrolimus, or with rapamycin. Shown is the mean ± SEM of three independent experiments for each treatment regimen. * represents p ≤ 0.05.
G. Comparison of the combined longitudinal analysis of CD127−/low cells in the total CD3+CD4+CFSE+ population between animals treated with no immunosuppression, with tacrolimus, or with rapamycin. Shown is the mean ± SEM of three independent experiments for each treatment regimen.


