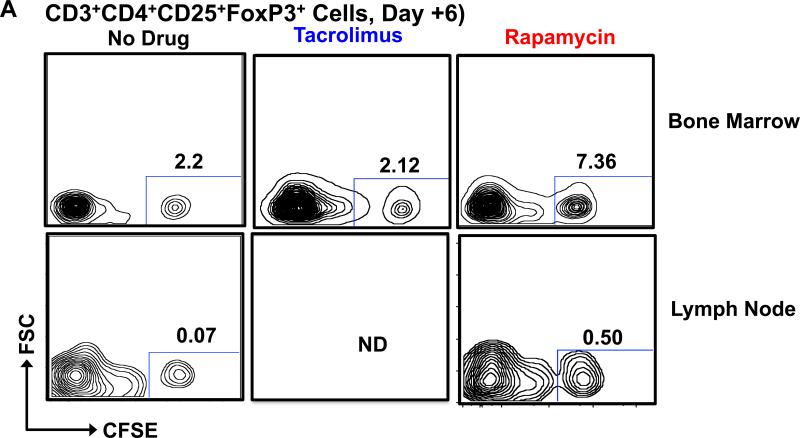
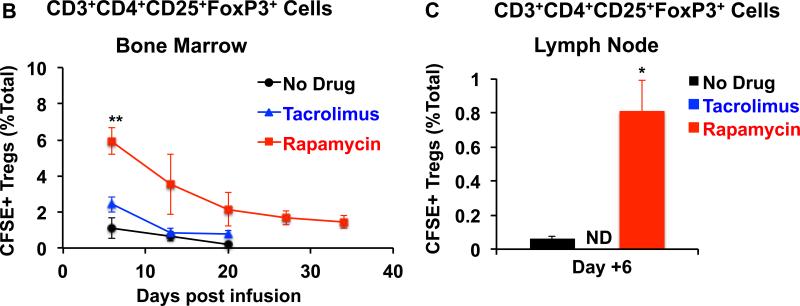
Figure 7. Increased frequencies of infused CFSE Tregs in bone marrow and LN in animals treated with rapamycin.
After transfer, infused CFSE + Tregs were quantified in the bone marrow and LN Treg pools (by determining the percentage of CFSE+ Tregs from the total CD3+CD4+CD25+FoxP3+ Treg pool) in animals treated with either no immunosuppression (bone marrow and LN), tacrolimus (only bone marrow) or rapamycin (bone marrow and LN). A. Representative flow cytometric analysis on Day + 6 for bone marrow and LN is shown. B. Longitudinal summary analysis for the bone marrow from animals receiving no adjunctive immunosuppression (black circles), tacrolimus (blue triangles), or rapamycin (red squares). Shown is the mean ± SEM (n = 3). ** represents p ≤ 0.01.
C. LN analysis on Day +6 after Treg transfer is shown for animals receiving no adjunctive immunosuppression (black) or rapamycin (red). Note: For technical reasons, the LN could not be excised in animals receiving tacrolimus. Shown is the mean ± SEM (n = 3). * represents p ≤ 0.05.


