
Figure 2.
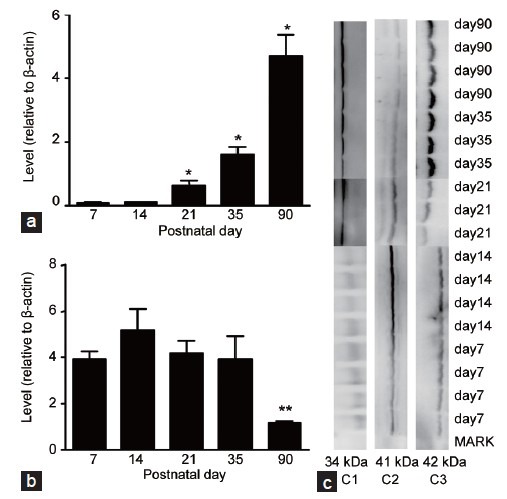
Western blot analysis of developmental fluctuations in 11β-HSD1 and 11β-HSD2 levels in rat testis. Testicular samples from rats at PND 7, 14, 21, 35 and 90 were subjected to western blotting analysis. For each sample, 60 μg protein was loaded. Relative protein levels of 11β-HSD1 (a) and 11β-HSD2 (b) were normalized to β-actin (means ± s.e.m. n = 3–6). The superscript asterisks show the statistical difference (*P < 0.05, **P < 0.01, the repeated measures of the general linear model, Mauchly's test of sphericity followed by pairwise comparisons with Bonferroni). (c) The pattern of immunoreactive proteins for each antibody. C1: 11β-HSD1 at 34 kDa; C2: 11β-HSD2 at 41 kDa; C3: β-actin at 42 kDa. PND: postnatal day; 11β-HSD1: 11β-hydroxysteroid dehydrogenase type 1; 11β-HSD2: 11β-hydroxysteroid dehydrogenase type 2; s.e.m.: standard error of the mean.