
Figure 4.
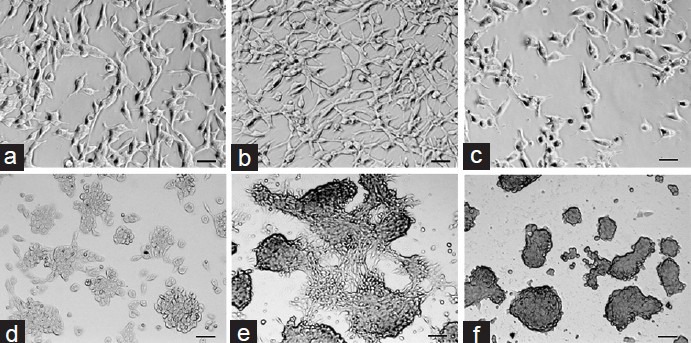
Photographs of LNCaP and MDA prostate cancer (PCa) 2b cells treated with testosterone (T) for 6 and 14 days respectively. The photos demonstrated that the PCa cells increased significantly in number and showed very active proliferation signs in their optimal growth condition (middle row, LNCaP cells in 0.1 ng ml−1 T and MDA PCa 2b in 1 ng ml−1 T). (a) LNCaP T 0 ng ml−1 day 6; (b) LNCaP T 0.1 ng ml−1 day 6; (c) LNCaP T 8 ng ml−1 day 6; (d) MDA PCa 2b T 0 ng ml−1 day 14; (e) MDA PCa 2b T 1 ng ml−1 day 14; (f) MDA PCa 2b T 8 ng ml−1 day 14. Scale bars=50 μm.