Fig. 2.

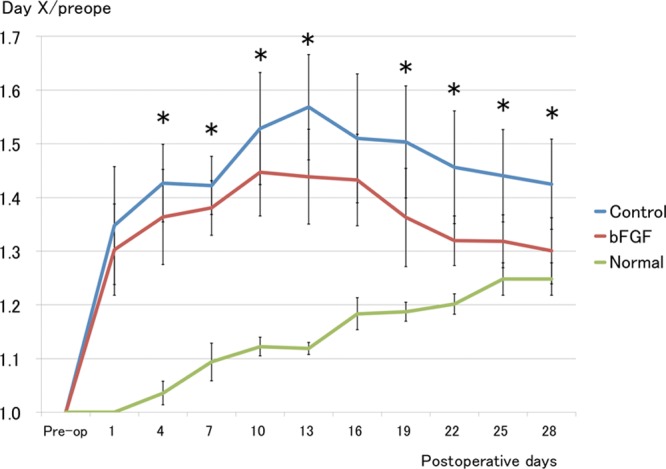
Tail volume measurements. Tail volume was smaller and decreased sooner in the bFGF group than in the control group. *P < 0.05 (t test). Control group and bFGF group: n = 15; normal group: n = 6.

Tail volume measurements. Tail volume was smaller and decreased sooner in the bFGF group than in the control group. *P < 0.05 (t test). Control group and bFGF group: n = 15; normal group: n = 6.