Fig. 6.

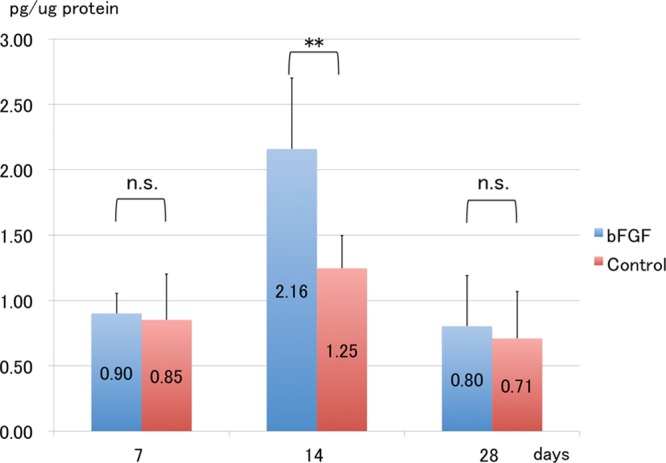
Protein levels of VEGF-C. Protein levels of VEGF-C are significantly increased in the bFGF group, compared with the control group on POD 14. **P < 0.01 (t test). Each group: n = 6. n.s. indicates not significant.

Protein levels of VEGF-C. Protein levels of VEGF-C are significantly increased in the bFGF group, compared with the control group on POD 14. **P < 0.01 (t test). Each group: n = 6. n.s. indicates not significant.