
Fig. 2.
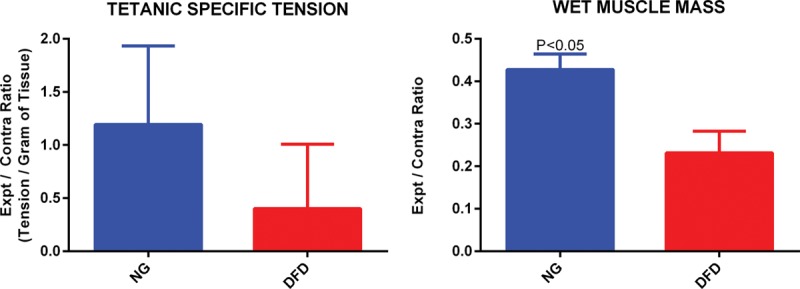
Muscle tetanic-specific tension ratio and wet muscle mass ratio comparison between NG and DFD groups. Student’s t test was used for statistical analysis.
Official websites use .gov
A
.gov website belongs to an official
government organization in the United States.
Secure .gov websites use HTTPS
A lock (
) or https:// means you've safely
connected to the .gov website. Share sensitive
information only on official, secure websites.
Muscle tetanic-specific tension ratio and wet muscle mass ratio comparison between NG and DFD groups. Student’s t test was used for statistical analysis.