
Fig. 3.
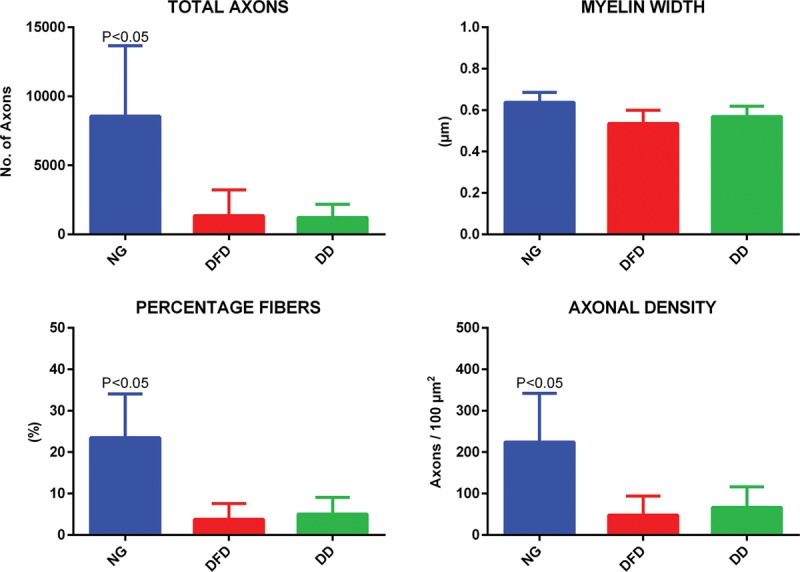
Quantitative histomorphometry comparison among NG, DFD, and DD groups. Total axons, myelin width, percentage fibers, and axonal density were used for comparison. Newman-Keul’s post hoc test was used for statistical analysis.
Official websites use .gov
A
.gov website belongs to an official
government organization in the United States.
Secure .gov websites use HTTPS
A lock (
) or https:// means you've safely
connected to the .gov website. Share sensitive
information only on official, secure websites.
Quantitative histomorphometry comparison among NG, DFD, and DD groups. Total axons, myelin width, percentage fibers, and axonal density were used for comparison. Newman-Keul’s post hoc test was used for statistical analysis.