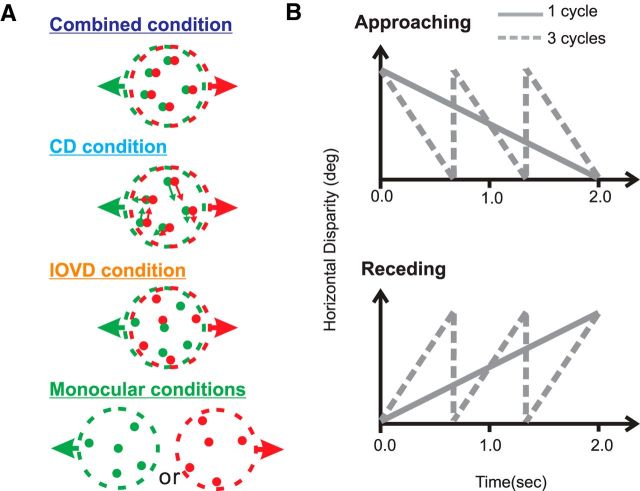
Figure 2.
A, Schematic illustration of the four main stimulus conditions used to test MT neurons. From top to bottom: Combined condition, CD condition, IOVD condition, and monocular control conditions. Green and red dots indicate images presented to the left and right eyes, respectively. See text for details. B, To generate motion in depth, the horizontal disparity of the stimulus was ramped up (receding) or down (approaching) linearly over time. The rate of change of horizontal disparity was varied from trial to trial. Gray solid lines indicate a stimulus condition in which there is one cycle of horizontal disparity change per trial; gray dashed lines indicate three cycles of disparity ramp per trial.

