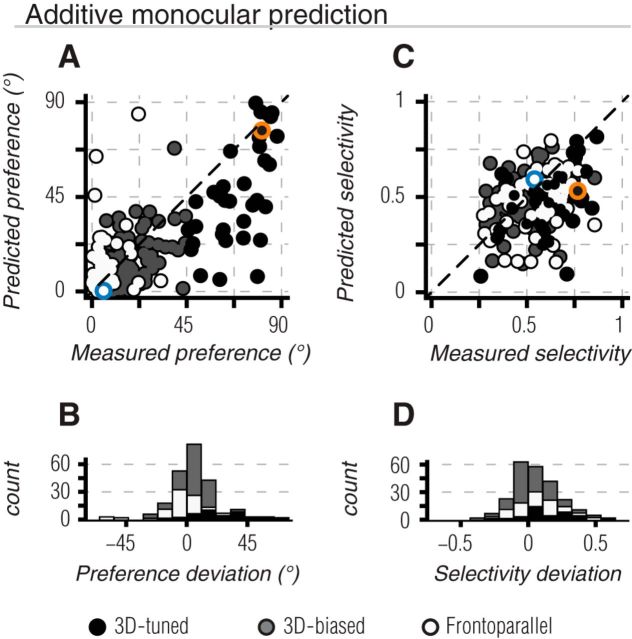
Figure 7.
Binocular tuning predictions based on summed monocular responses. A, Scatter plot of predicted binocular preference as a function of the measured binocular preference. Preferences are quantified relative to the frontoparallel axis shown in Figure 4, such that 0° indicates purely frontoparallel motion, and 90° indicates direct 3D motion. 3D-tuned, 3D-biased, and frontoparallel units are shown by black, gray, and white points, respectively. By definition, all 3D-tuned units lie to the right of x = 45°. Most of the units fall below the line of unity (black dashed line), reflecting an underestimate of the 3D component of binocular direction preference. B, Histogram of deviations between measured and predicted direction preference across the recorded population. Positive values indicate cases in which the measured preference was shifted toward the 3D motion axis (below unity in A). Negative values indicate shifts in preference toward the frontoparallel axis (above unity in A). C, D, Same as A, B but comparing measured and predicted selectivity. Both 3D-tuned and frontoparallel units exhibited stronger selectivity than predicted. Positive values in D indicate that the measured selectivity was greater than predicted; negative values indicate the opposite. Example units of Figures 2A–D and E–H are indicated in A, C by blue and orange markers, respectively.

