
Figure 9.
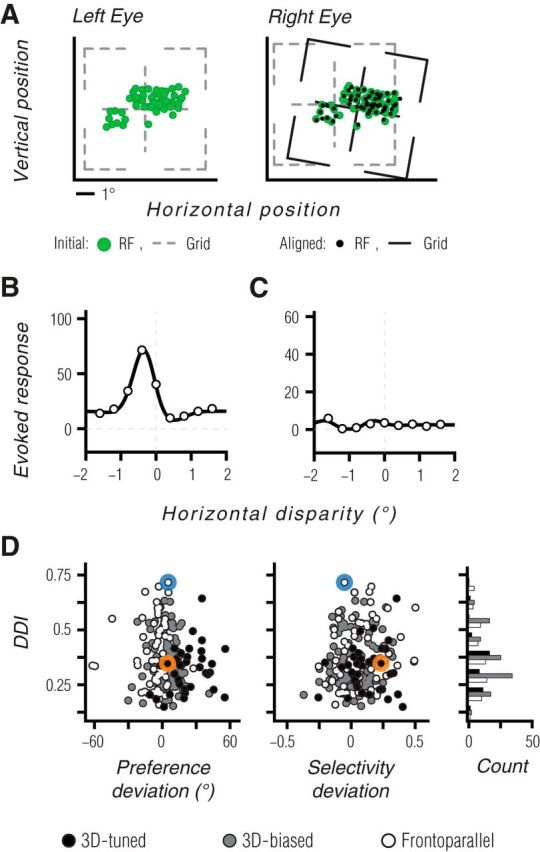
Tuning for static disparity does not explain 3D motion tuning. A, Our approach for achieving accurate measurements of disparity tuning in anesthetized, paralyzed animals. Panels show spatial receptive field centers (green points) in the left and right eyes, for a population of binocular V1 units recorded at the same time as an MT recording. Black points on the right eye panel indicate locations corresponding to the left eye receptive field centers, after applying the binocular alignment transformation. B, C, Disparity tuning curve for the example neuron of Figure 2A–D is shown in B, and for the neuron of Figure 2E–H in C. Measurements are based on coherent dot fields moving in the preferred frontoparallel direction, at a range of horizontal disparities. Solid lines show fits of a Gabor function (DeAngelis and Uka, 2003) used for display purposes only. D, A comparison of the DDI and the deviations between measured and predicted 3D motion preference and selectivity. Black, gray and white symbols indicate 3D-tuned, 3D-biased, and frontoparallel units, respectively. Blue and orange symbols indicate the data from the example units. A histogram of DDI values for each binocular tuning subset is shown in the far right. 3D-tuned units had slightly lower DDI values than other units. There was no consistent relationship between the DDI values and the deviations of the measured tuning properties from the monocular-based predictions.