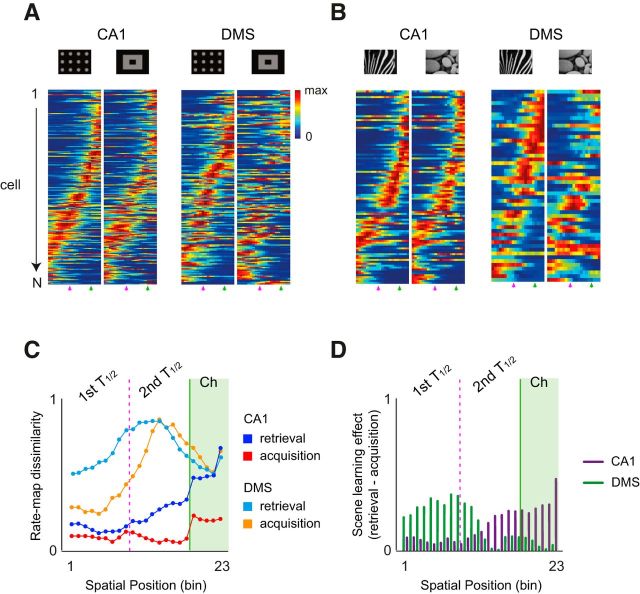
Figure 10.
Different scene-learning effects on neuronal populations in CA1 and DMS. A, B, Population firing rate maps built by ordering 2D rate maps associated with the different visual scenes for retrieval (A) and acquisition (B). Pink arrowheads indicate the boundaries between the first half and the second half of the track. Green arrowheads indicate the end of the track beyond which the rat reared its upper body to make touch responses. C, Amount of dissimilarity (based on spatial correlation: 0 = being identical; 1 = being completely orthogonal) between rate maps associated with different visual scenes in the CA1 and DMS across the learning stages (retrieval vs acquisition). Spatial bin of 23 is toward the touchscreen. Pink dotted line indicates the boundary between the first half and the second half of the track. Green line indicates the end of the track. D, Learning effects (difference in rate-map dissimilarity between retrieval and acquisition) differentially observed at different track positions between the CA1 and DMS.

