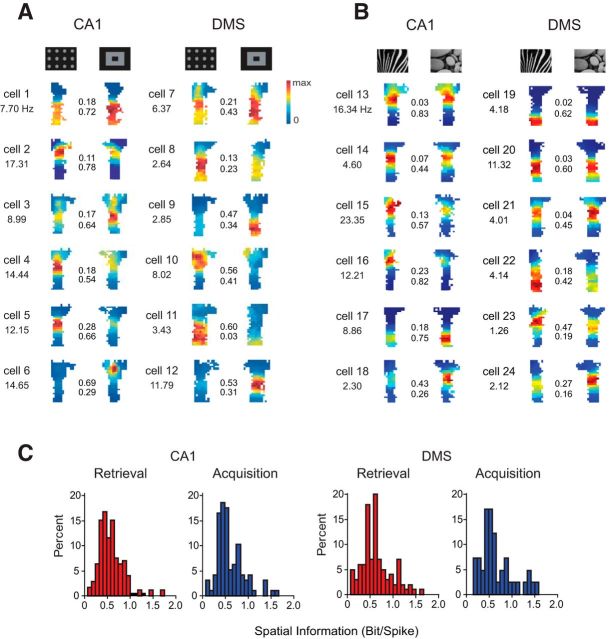
Figure 5.
Spatial firing patterns and scene-associated rate modulation in CA1 and DMS. A, B, Representative spatial firing rate maps for different scenes within a session for individual neurons during retrieval (A) and acquisition (B) periods. The maximal firing rate is given underneath the cell number. The values in-between firing rate maps are the scene selectivity index (top) and the correlation coefficient between the scene-associated rate maps (bottom). C, Distribution of spatial information scores for CA1 and DMS during retrieval and acquisition.

