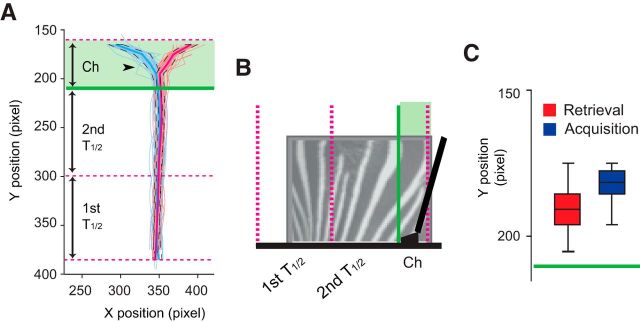
Figure 7.
Movement trajectories. A, Overview of the representative movement trajectories associated with the trials in which the left (blue) and right (red) response boxes were chosen (regardless of scene stimuli). The mean trajectories (blue and red solid lines) and the boundaries for 1 SD (black dashed lines) from the mean were illustrated for both left and right trajectories. Green line indicates the end of the track. The transparent green area represents the space in which the rat reared its body to make touch responses on the screen. Black arrowhead indicates the point at which the x-positions of the two trajectories were diverged from each other. Pink dotted lines indicate the boundaries between analytical zones in the current study. 1st T1/2, First half of the track; 2nd T1/2, second half of the track; Ch, choice zone. B, Side view of the track with zone boundaries marked in pink dotted lines. The touchscreen and the food tray underneath the screen are shown in black. Start box is not shown. C, Box plot showing the distributions of the diverging points of position traces from all recording sessions. Green line indicates the end of the track position.

