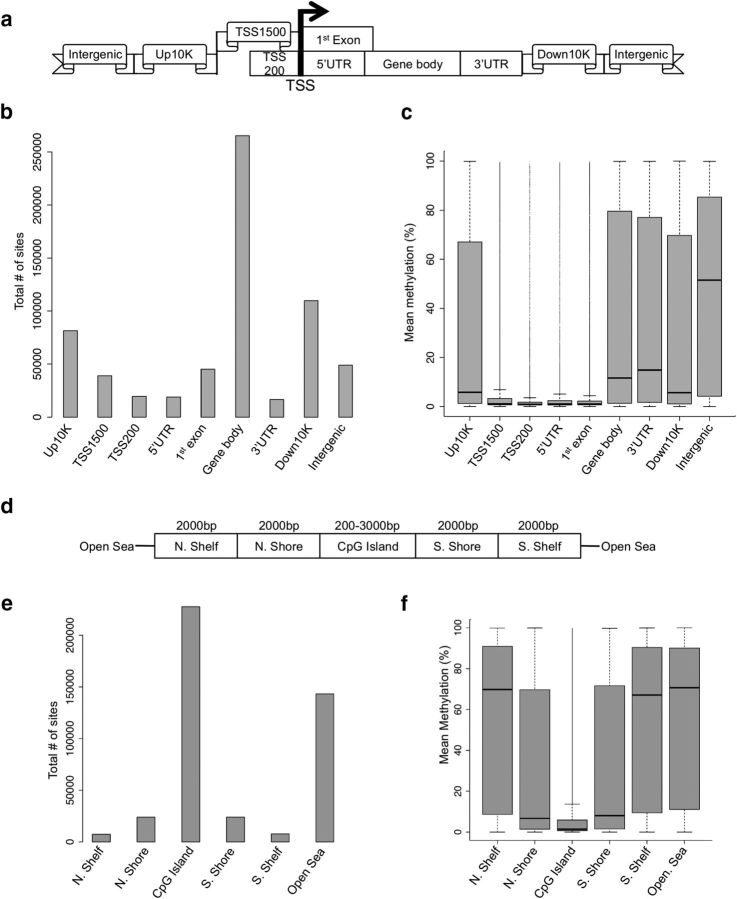
Figure 1.
Methylation differs across the regions of the genome (a–c) and CpG islands (d–f). Standard regions of the genome (a) were used for analyses of density and methylation. Specifically, methylation data distributions were classified depending on how they fell in regard to: the TSS, regions defined as 200 bp upstream of the TSS (TSS200), 1500 bp upstream of the TSS (TSS1500), the 5′ and 3′UTRs, the 10 kb upstream of the gene body (Up10K), and 10 kb downstream of the gene body (Down10K). Distributions of methylation data were binned into these groups based on both density of reads (b) and mean percentage DNA methylation (c), revealing genome region-specific methylation patterns. A similar strategy was used to assess patterns of methylation across CpG islands, which were defined as at least 200 bp stretch of DNA with a C+G content of >50% and an observed CpG/expected CpG in excess of 0.6. CpGs were grouped (d) as those that fell into: CpG island north and south shores (0–2 kb from the island edges), CpG island north and south shelves (2–4 kb from the island edges), and the “open sea” (>4 kb from any island edge). Distributions of methylation data were binned into these groups based on both density of reads (e) and mean percentage DNA methylation (f), revealing CpG-island specific methylation patterns.

