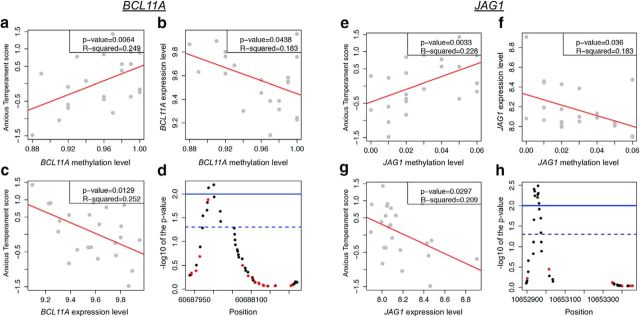
Figure 3.
The correlations between AT, DNA methylation, and gene expression for BCL11A (a–d) and JAG1 (e–h). For each of these genes, we identified methylation sites where the methylation levels were correlated with individual differences in AT (a, e; p values shown are aLIS p values) and gene expression (b, f). Moreover, expression levels of BCL11A and JAG1 were also correlated with individual differences in AT (c and g, respectively). Importantly, a cluster of CpGs demonstrated correlated methylation differences to AT (d, h; red represents positive; black represents negative) that reached statistical significance (FDR <0.05, dashed line; and FDR <0.01, solid line).

