Figure 5.

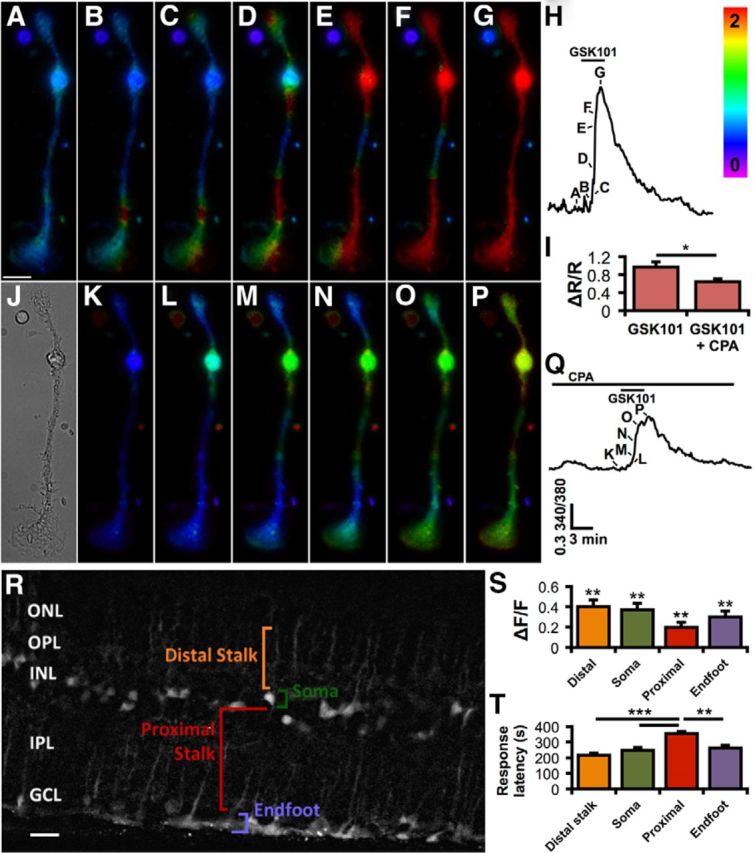
TRPV4 activation triggers Ca2+-induced Ca2+ release and calcium waves. A–H, Upon applying 25 nm GSK101 (B–G), calcium typically first flows into Müller glial endfeet (bottom) or their apical process (top). Calcium then elevates as a wave, filling the cytosol globally. Scale bar, 10 μm. The timing of the images (A–G) is indicated in the corresponding calcium trace (H). The rainbow scale specifies the 340/380 ratio level. I, TRPV4 stimulation by GSK101 further elevates Ca2+ via Ca2+ release (stores depleted by bathing cells with 5 μm CPA while stimulating release with applications of 20 μm carbachol). n = 19. J, A bright-field image of the Müller cell. K–P, Store depletion by CPA attenuates the response to GSK101 (L–P) and the resulting wave. The corresponding trace (Q) indicates timing of images (K, L). R, OBG-1 selectively loaded Müller glia in a retina slice. Four of the main Müller cell compartments are labeled for one cell. This image is the median composite of 10 temporally adjacent images separated by 3 s in time during the response to GSK101. The contrast between the Müller cells and the background was enhanced with the application of the rolling ball background subtraction function in ImageJ (10.0 pixel radius). ONL, Outer nuclear layer; OPL, outer plexiform layer; INL, inner nuclear layer; IPL, inner plexiform layer; GCL, ganglion cell layer. Scale bar, 10 μm. S, Responses to 10 μm GSK were significantly above the baseline for all cellular compartments. T, The distal stalks and endfeet were the primary transduction sites, as indicated by shorter response latencies (time to ½ peak). n = 13 for distal stalk, 23 for somata, 16 for proximal stalk, and 13 for endfeet. *p < 0.05. **p < 0.01. ***p < 0.001.
