
Figure 10.
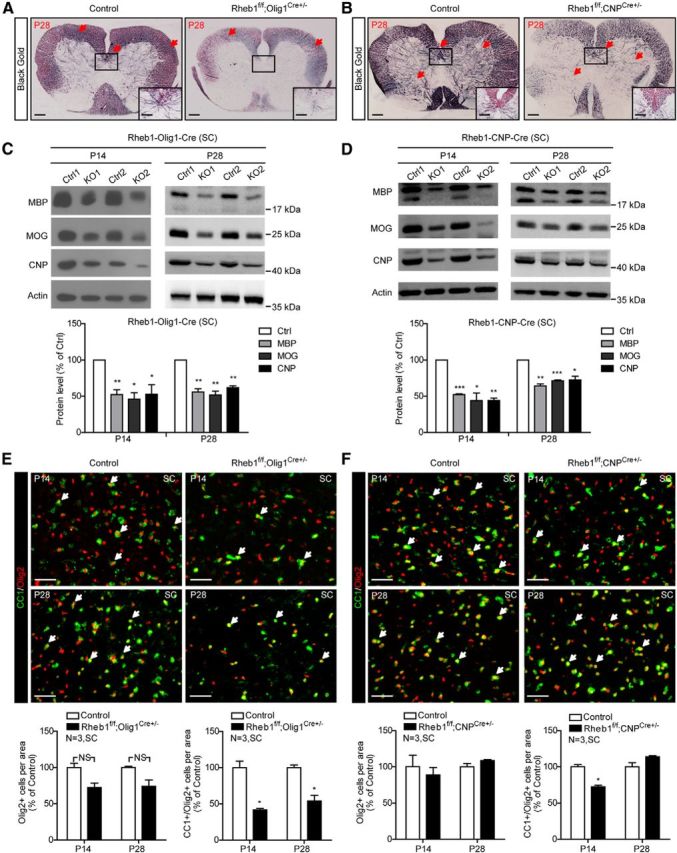
Myelin deficit in the spinal cord of Rheb1f/f;Olig1Cre+/− and Rheb1f/f;CNPCre+/− mice. A, B, Black Gold staining of P28 control (Rheb1f/+;Olig1Cre+/−) and Rheb1f/f; Olig1Cre+/− (A) and control (Rheb1f/+;CNPCre+/−) and Rheb1f/f; CNPCre+/− (B) mice. Arrows indicate the Black Gold-positive areas in control and comparable areas in mutant brain. Scale bar, 200 μm. Insets show higher magnification of the boxed regions. Scale bar, 100 μm. C, D, Western blot analysis of myelin protein expression in the spinal cord (SC) of Rheb1f/f; Olig1Cre+/− (C) and Rheb1f/f; CNPCre+/− mice (D) at P14 and P28. All quantifications are expressed as percentage control ± SEM. C, P14: MBP, **p = 0.0096; MOG,*p = 0.0132; CNP, *p = 0.0356; P28: MBP, **p = 0.0049; MOG, **p = 0.0055; CNP, **p = 0.0022. D, P14: MBP, ***p = 0.0003; MOG,*p = 0.0164; CNP, **p = 0.0020; P28: MBP, **p = 0.0029; MOG, ***p = 0.0004; CNP, *p = 0.0170. E, F, Immunostaining of CC1+/Olig2+ cells (arrows) in the spinal cord of Rheb1f/f;Olig1Cre+/− (E) and Rheb1f/f;CNPCre+/− (F) mutants at P14 and P28. Quantification of total Olig2+ (OL lineage cells) and CC1+/Olig2+ (differentiated OLs) in the spinal cord are shown (bottom). E, P14, *p = 0.0254; P28,*p = 0.0102; (F) P14, *p = 0.0271. Scale bar, 40 μm.