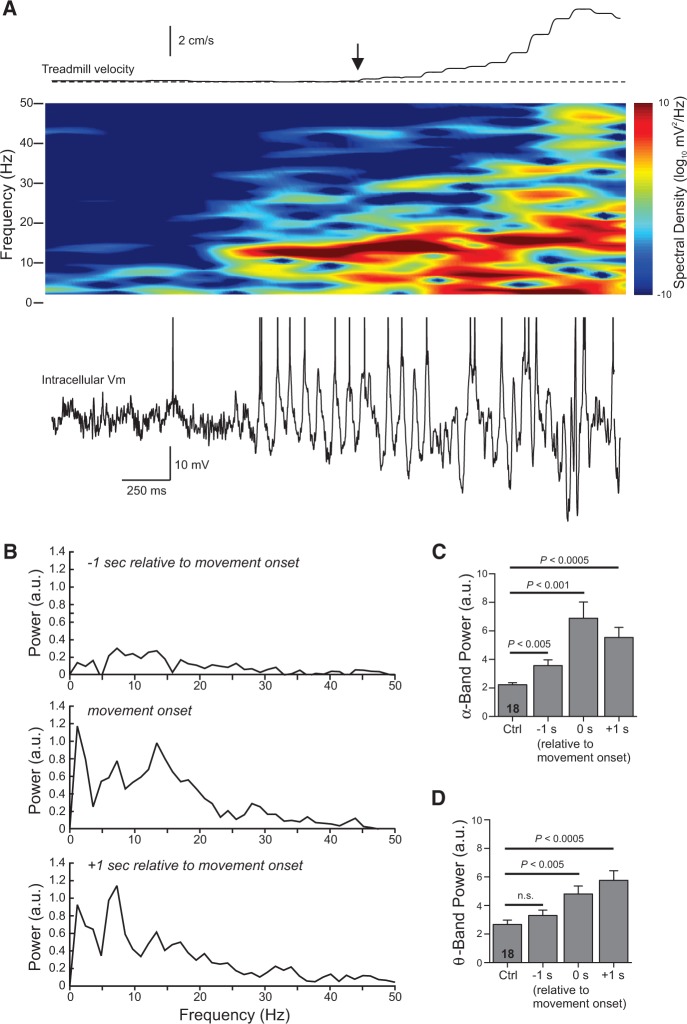
Figure 2.
Spectral analysis of intracellular responses during movement onset. (A) Spectrogram computed from the membrane potential during a 3-sec duration window that included the onset of a spontaneous movement epoch (vertical arrow). Combined treadmill velocity plotted above spectrogram. Action potentials truncated in example trace shown. (B) Average power spectra computed from 18 spontaneous movement epochs >3 cm from 10 cells during the three 812-msec time windows indicated above each plot. The power spectrum coincident with movement onset showed a primary peak in the α-band (13.4 Hz). The primary peak shifted to the θ-band (7.3 Hz) in the spectrum computed 1 sec following movement onset. (C) Plot of the integrated spectral power with the α-band (8–15 Hz) during quiescent periods (Ctrl) and during movement onset (same three time windows analyzed in B). The average α-band power significantly increased over control levels in all three time windows, including the window that started 1 sec before detectable movement. Repeated-measures ANOVA (F(3,51) = 15.09, P < 5 × 10⁻⁷) followed by paired t-test with a Bonferroni correction of 3; n = 18 epochs. (D) Plot of the integrated spectral power during the θ-band (4–7 Hz) for the same spontaneous movement epochs analyzed in B and C. Average θ-band power was not significantly elevated before the movement onset (P = 0.06; paired t-test) but was immediately after the movement began. Repeated-measures ANOVA (F(3,51) = 12.86; P < 5 × 10⁻⁶); n = 18 epochs.

