
Figure 3.
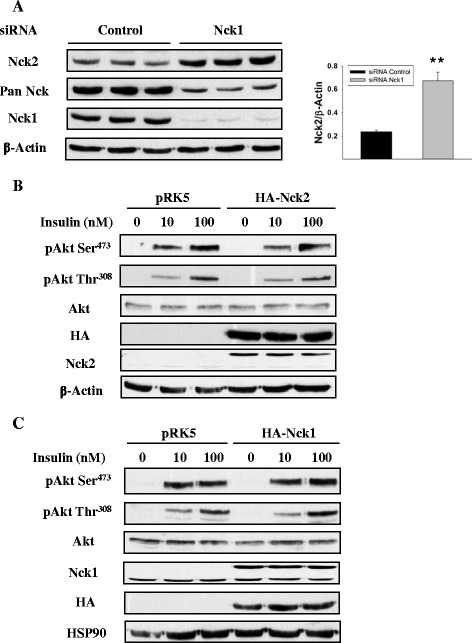
Akt phosphorylation in HepG2 cells overexpressing Nck. (A) Total cell lysates from HepG2 cells transfected with control or Nck1 siRNA were subjected to immunoblot with indicated antibodies. Bar charts represent mean ± SEM of the ratio of Nck2/β-Actin. **P <0.01 versus control. Total cell lysates from HepG2 cells transfected with pRK5, HA-Nck2 (B) or HA-Nck1 (C) plasmids were subjected to immunoblot with indicated antibodies. Data are representative of three independent experiments showing similar results.