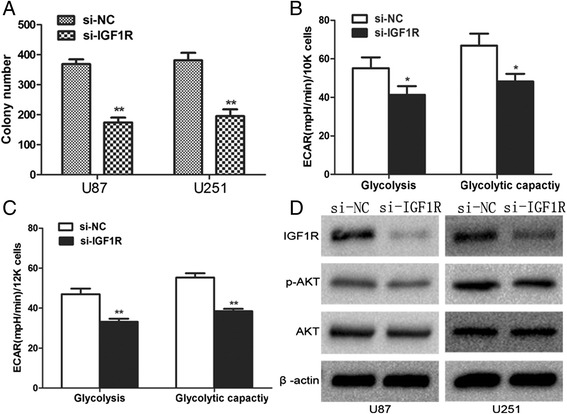
Figure 4.

IGF1R impact growth and glycometabolism of glioma cells. (D) IGF-1R, AKT, pAKT protein levels in U87 cells and U251 cells transfected with siIGF1R were assessed by Western blot. (A, B, C). Representative cartogram showing proliferation and glycometabolism regulated by siIGF-1R. Each data point represents the mean ± SD of three experiments. *p <0.05, **p <0.01.
