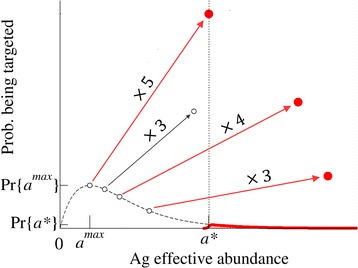
Figure 3.

Probability of targeting self-Ag in basal conditions (curve) and after pathological over-expression (isolated points). The arrows indicate multiplicative changes in the effective abundances of several self-Ag (increase factors are written on the arrows). Only those Ags with effective abundances greater than the threshold a * can induce a response (red symbols). Note that, due to peripheral tolerance, the targeting probability for Ag with abundances below a * is effectively zero; the values represented in black (dashed line and open symbols) correspond to the targeting probabilities in the absence of peripheral tolerance as given by eqn. (8b). The MDI in this example has been set to 5, which means that an Ag with basal abundance equal to a max has to be over-expressed by a factor 5 in order to reach the threshold abundance a *.
