
Figure 1.
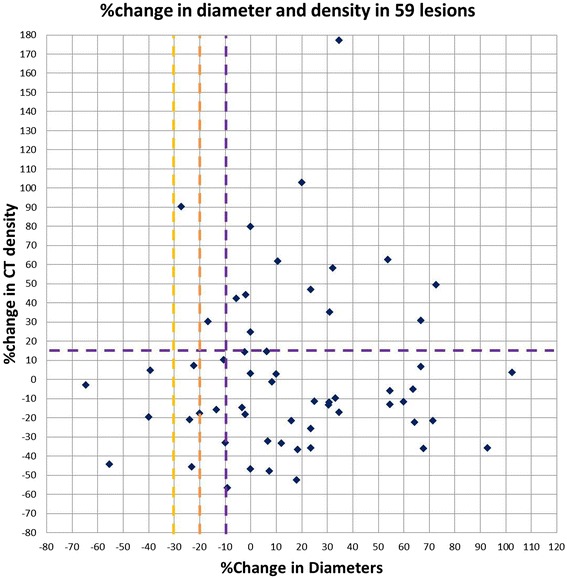
Scatter plot of the percent changes of the tumor diameter and density on the first follow-up CT compared to the baseline CT in 59 lesions. The cut-off values for response are indicated by the yellow dashed line for RECIST (≥30% diameter decrease), by the orange dashed line for MASS (≥20% diameter decrease), and by the purple dashed lines for Choi (≥10% diameter decrease or ≥15% density decrease) criteria. No lesions met the density response criteria by MASS.